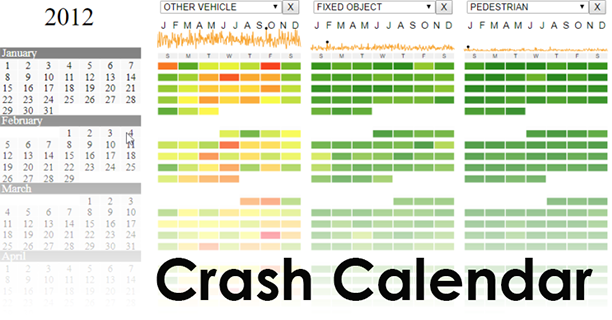
Crash Calendar

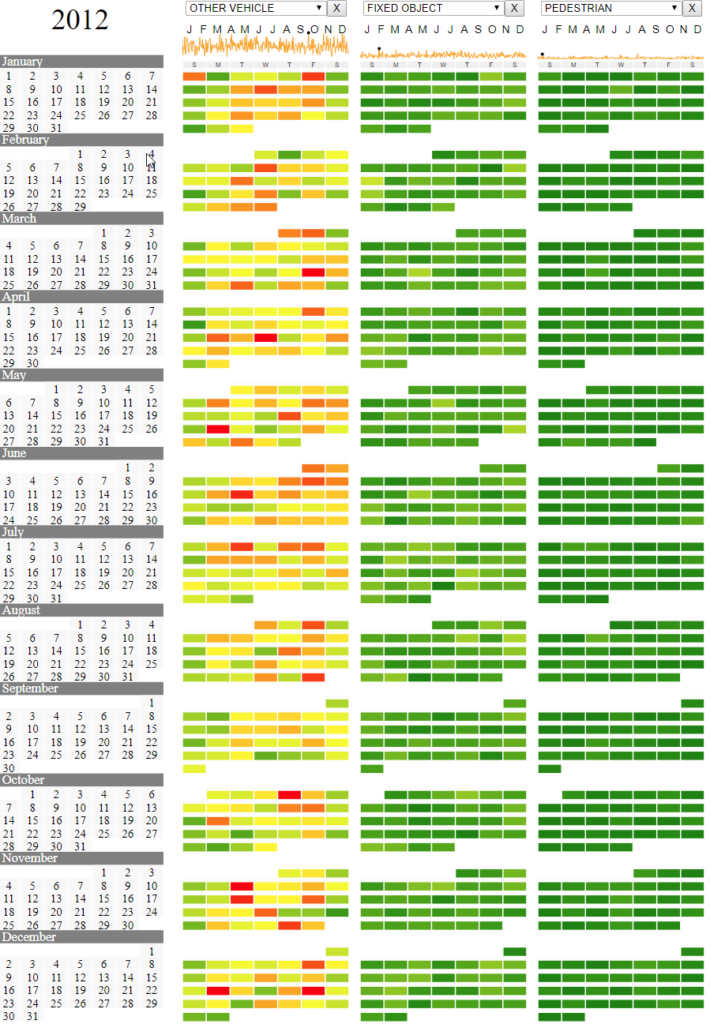
Working with Joni Graves at the University of Wisconsin, we created a digital interpretation of her Crash Calendar. The Wisconsin Bureau of Transportation Safety (BOTS) uses Mrs. Graves’ original Crash Calendar to analyze what factors contribute to crashes and to foster conversation about how to reduces crash rates. Our Crash Calendar is seeded with data from the Maryland Department of Transportation’s CHART system to help bring the kinds of insights that Wisconsin is making over to the Old Line State.
Our version adds interactivity, letting users dynamically filter crash data by type, date, and any other properties within the CHART data set. Calendars show crash counts for every day of the year and allow the user to hone in on days or periods of days that were fraught with abnormally high crash counts. Each filtered crash type is shown as a separate calendar, providing a side-by-side analysis of different crash types. Sparklines along the top of each calendar capture the peaks and troughs in crash counts throughout the year. Clicking on a day’s cell will show a bar chart with the number of accidents for that day, broken out by hour.

