Safety Explorer and Enforcement Assessment Dashboards

Commercial Motor Vehicle (CMV) safety is critical in traffic management and public safety. In Maryland, CMVs account for a substantial share of traffic incidents, comprising up to 24.5% of 105,000 incidents recorded in the Maryland State Police (MSP) database in 2024, and 18.27% of 82,000 incidents in 2023. Therefore, monitoring CMV safety and safety innovations is crucial for ensuring safe and efficient highway movement. With this objective in mind, the Center for Advanced Transportation Technology Laboratory (CATT Lab) has developed a series of CMV analysis dashboards. These dashboards were designed in collaboration with local and state CMV safety enforcement professionals and the Federal Motor Carrier Safety Administration (FMCSA) to facilitate intuitive and efficient analysis of CMV safety performance metrics. While the dashboards described below were created specifically for use in Maryland, this tool could easily be expanded for use anywhere in the nation that citation data, trip analytics data, and probe speed data are made available.
Identifying locations for proactive enforcement
Three CMV safety explorer dashboards were created to empower CMV safety professionals in identifying locations with a history of safety performance deficiencies. These dashboards enable the analysis of probe speed data, crash events, CMV inspection and citation data, and trajectory data to illustrate instances of detouring in response to enforcement measures. A supplementary evaluation dashboard was developed to automate the analysis of CMV enforcement initiatives by comparing the safety performance before, during, and after enforcement (halo effect). These dashboards utilize the same performance metrics employed to select enforcement sites. To demonstrate the practicality of these dashboards, the CATT Lab partnered with the MSP to apply the dashboards in a real-world scenario to select and evaluate enforcement initiatives on I-81 in Maryland.

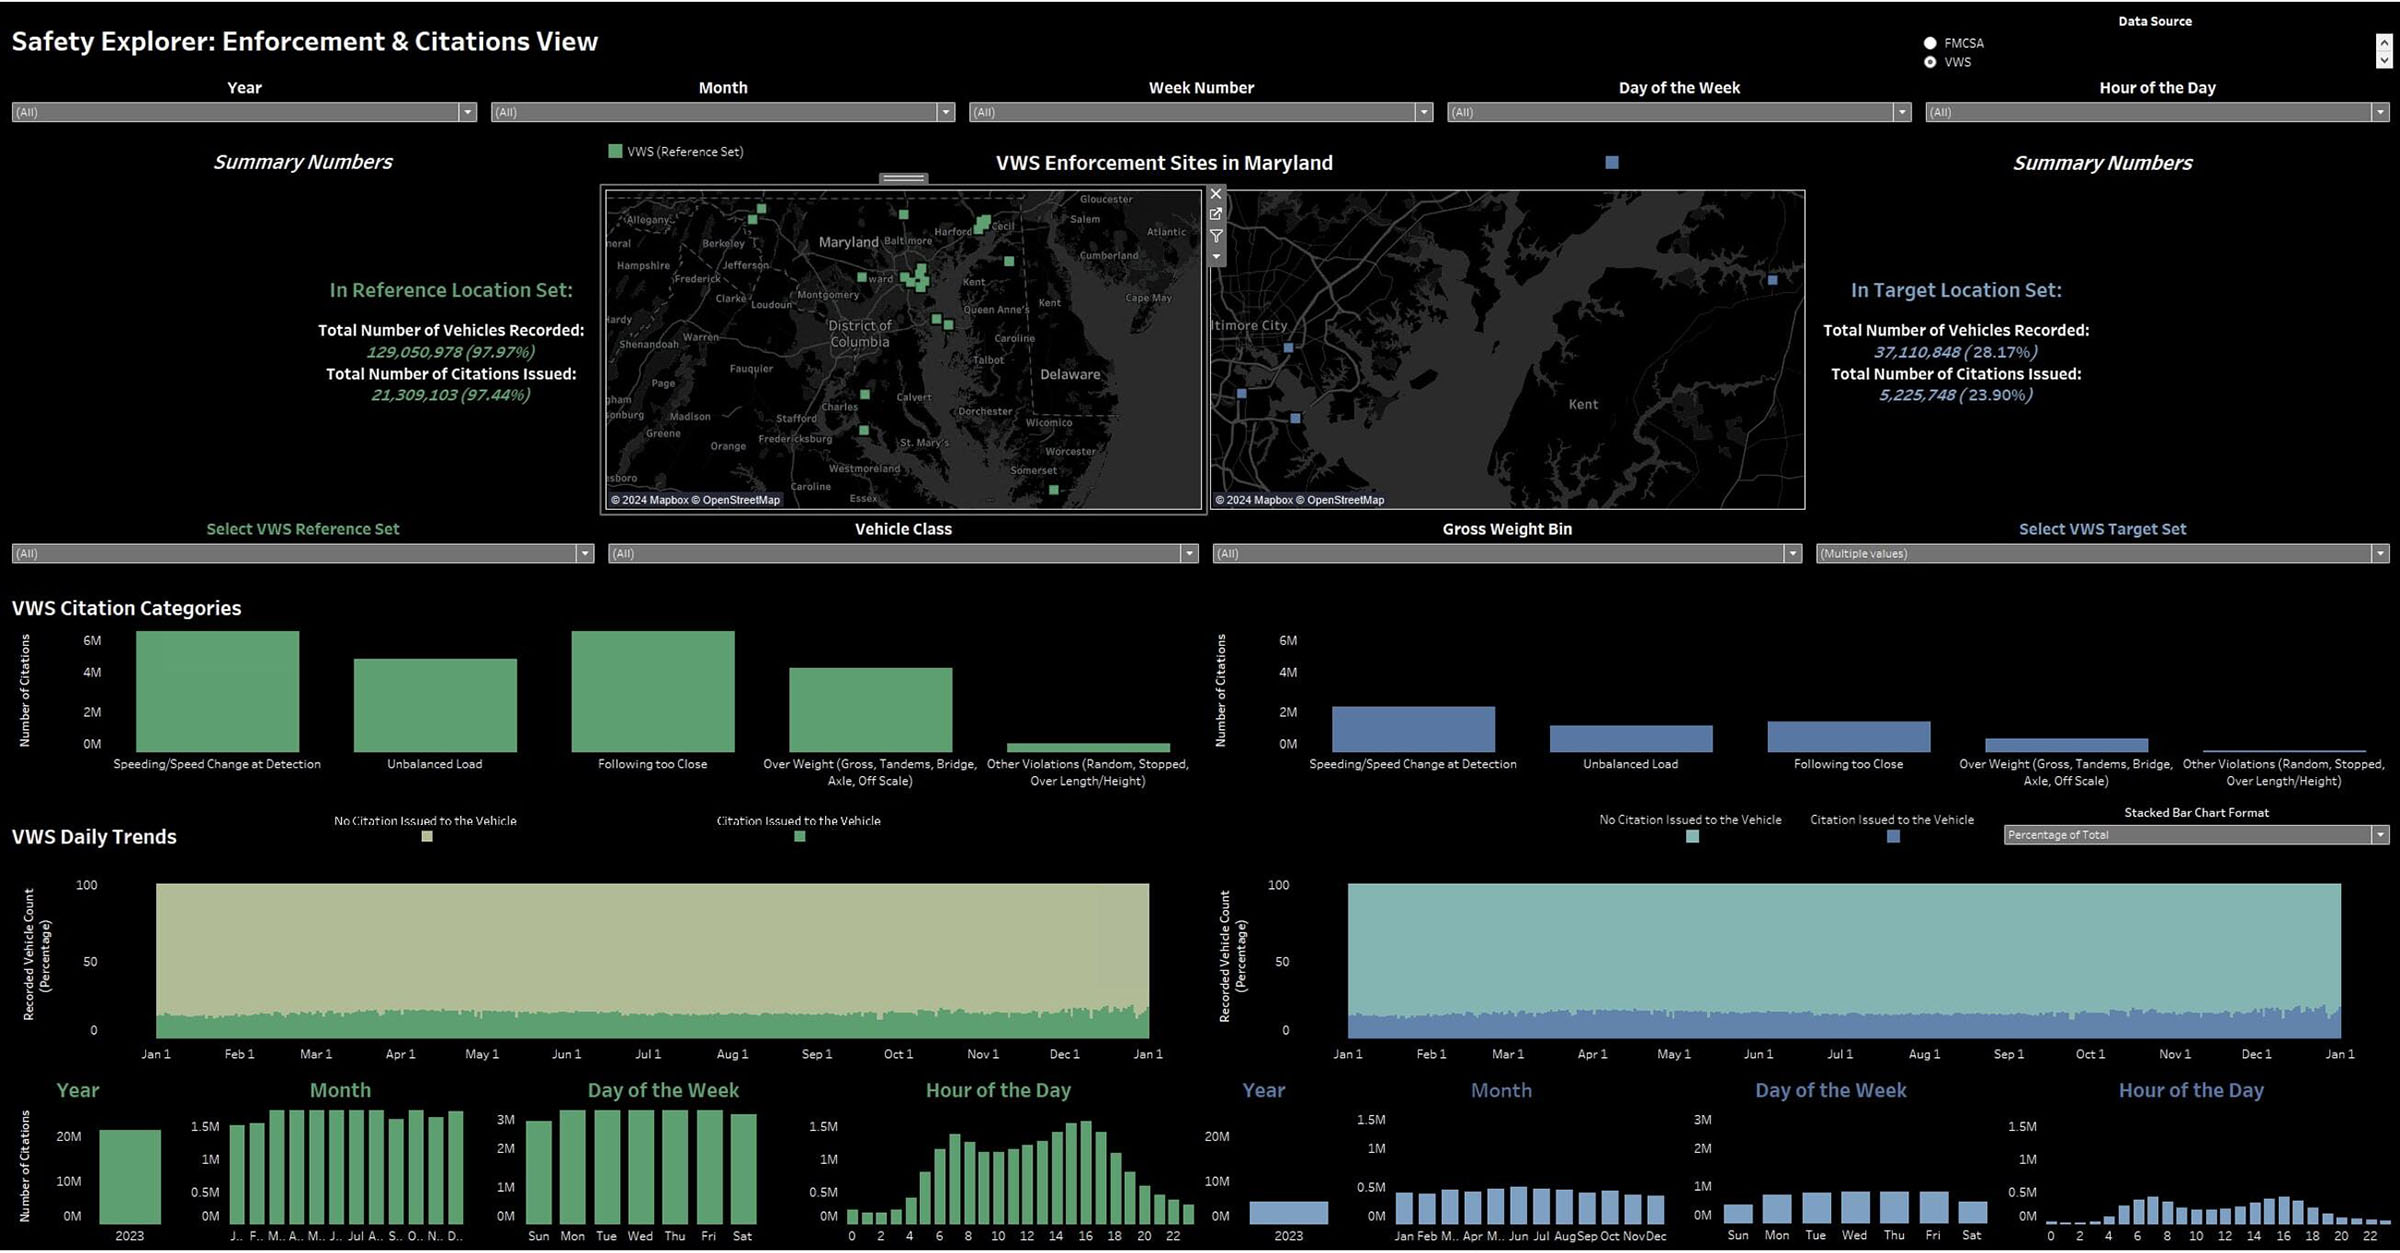
Safety Explorer: Enforcement & Citations View
The Enforcement & Citations View allows users to search and explore citation activity at enforcement sites across the State of Maryland. You can see the number of citations ranked by category (such as citations resulting from lack of vehicle maintenance or unsafe driving) then see what proportion of these citations resulted in vehicles being rendered out of service post-citation. The dashboard also shows daily citation trends over an entire year, along with summaries on a year, month, and day-of-week basis.

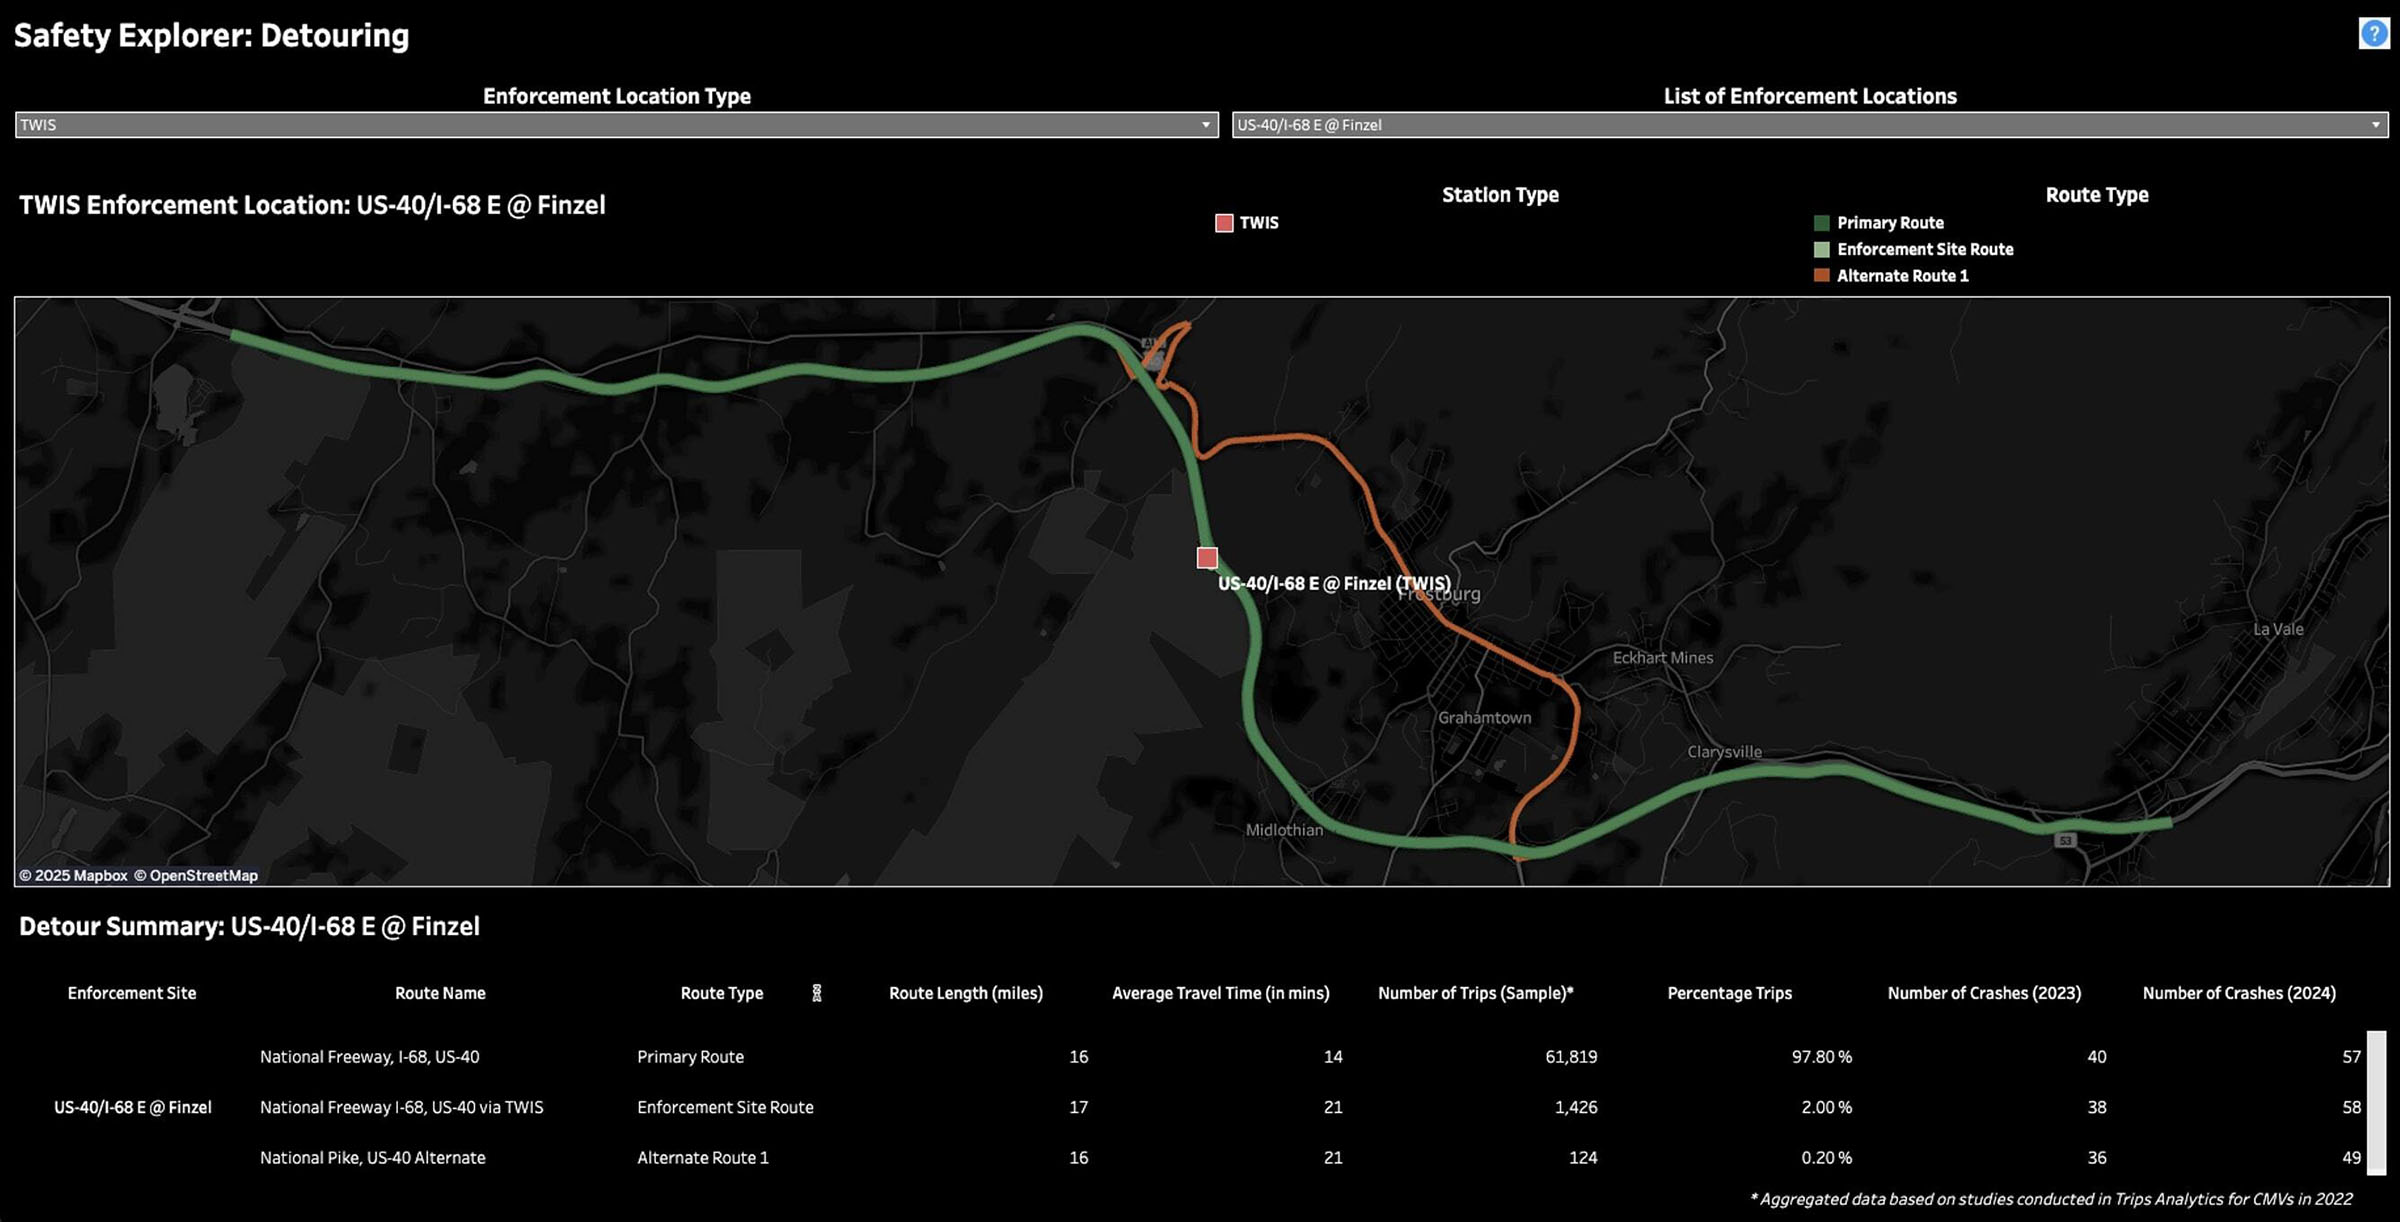
Safety Explorer: Detouring
Commercial vehicle enforcement activity commonly occurs at known locations, such as scale houses or weigh stations. Commercial vehicle operators looking to evade enforcement have been known to take alternative routes to avoid common enforcement locations. This activity can place large trucks on roads less suited to handle them, which can reduce safety for truck drivers and the motoring public. The Detouring dashboard displays common alternate routes taken by commercial vehicles, along with the typical percentage of commercial vehicles that take the alternate route compared with the primary route. This information allows agencies to identify alternate locations for commercial vehicle enforcement to catch evaders.
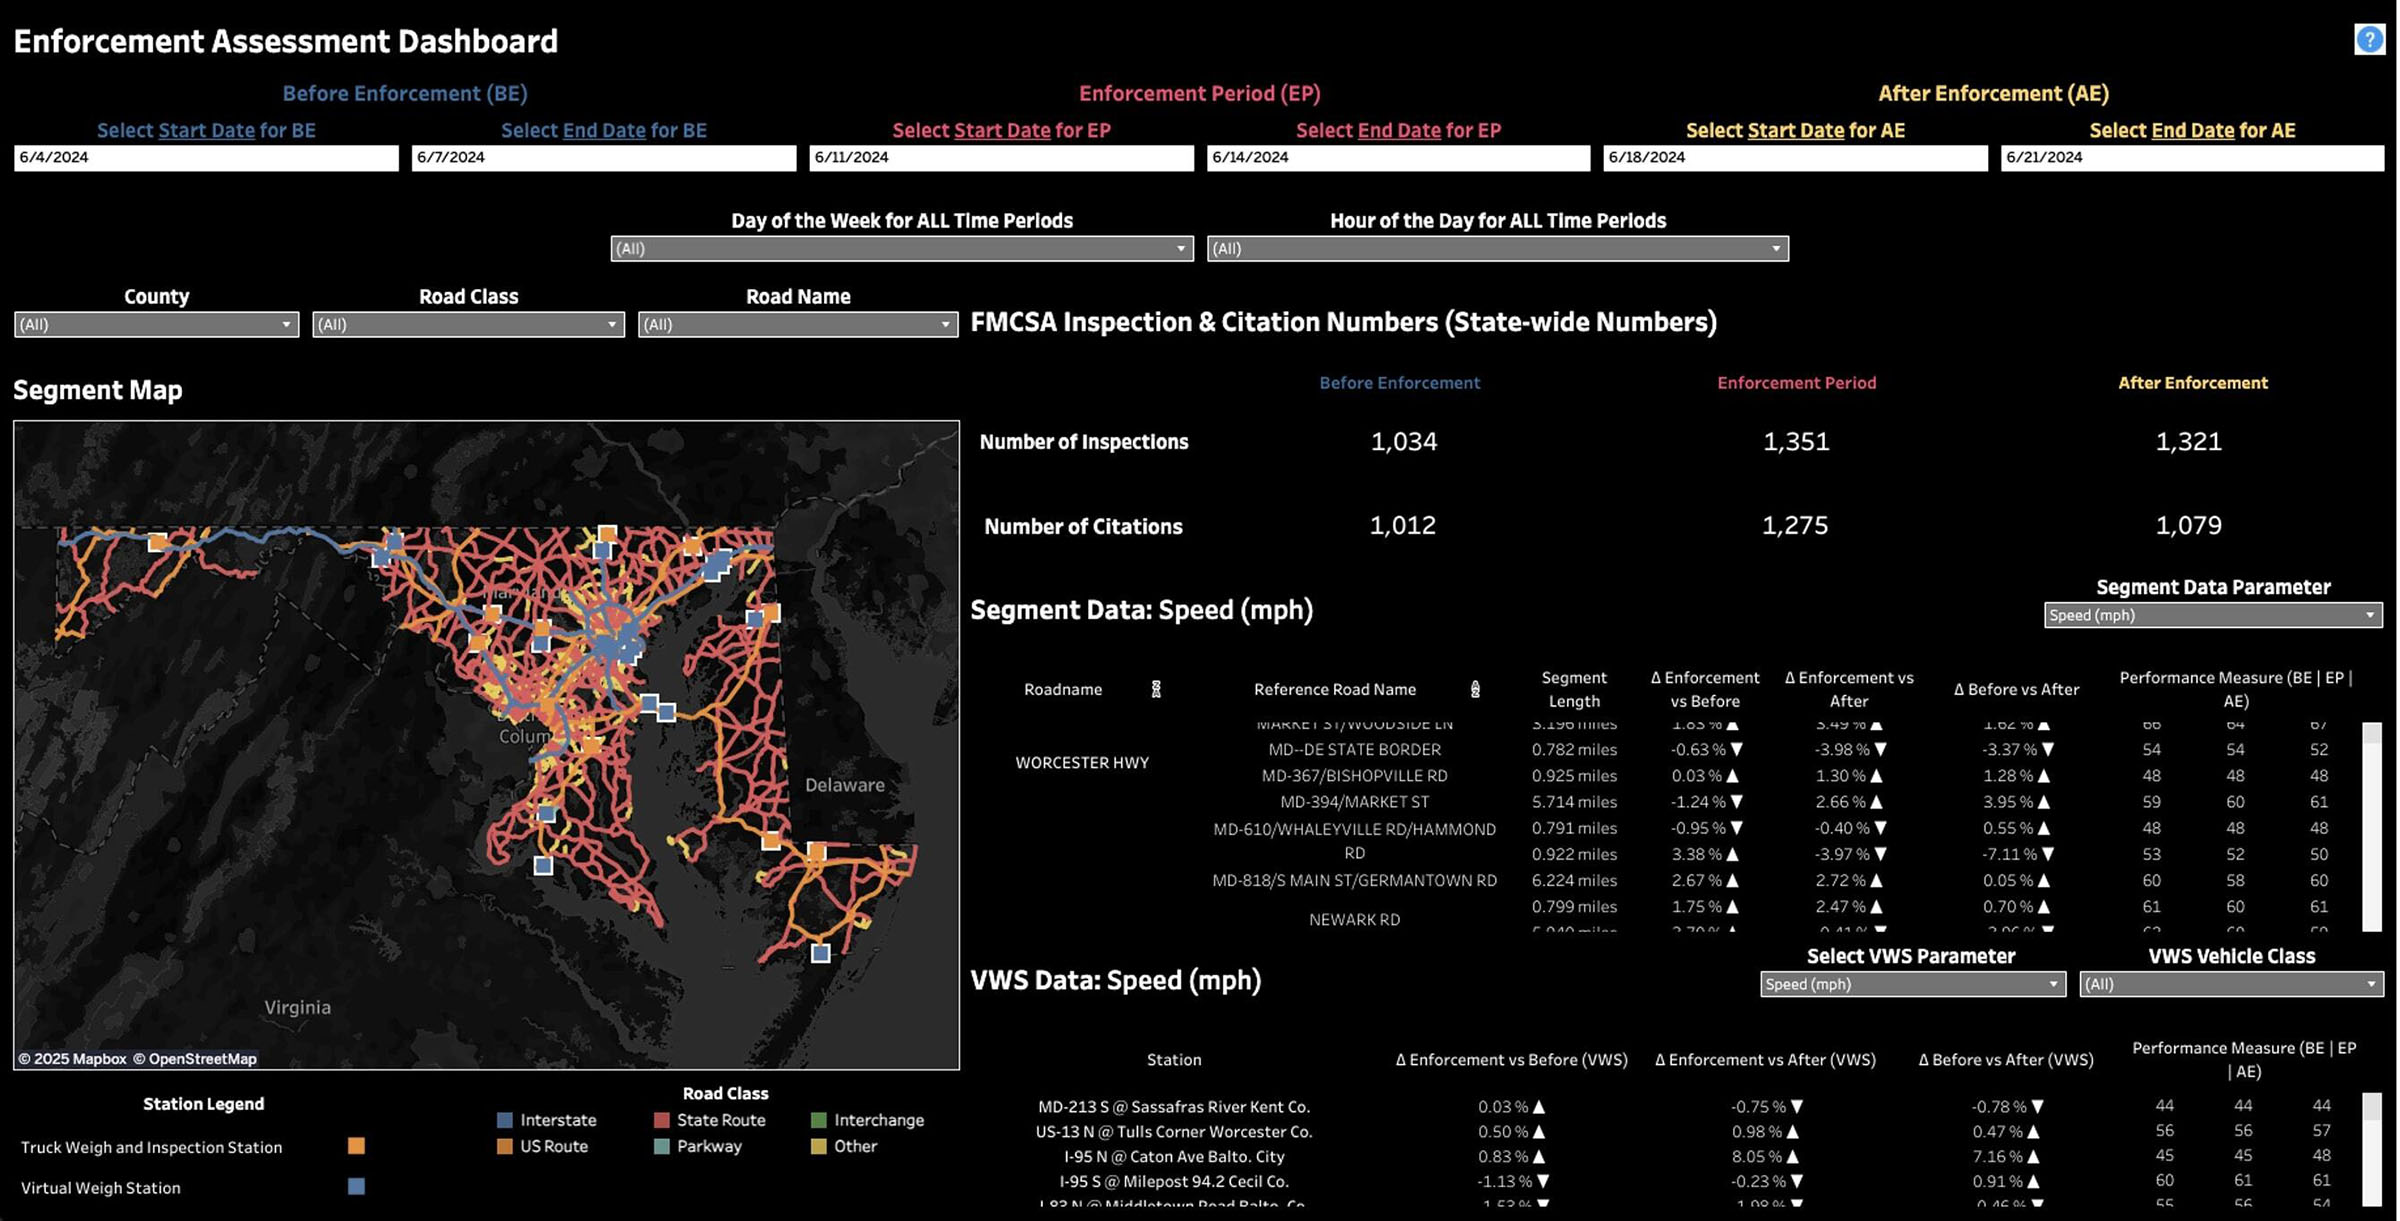
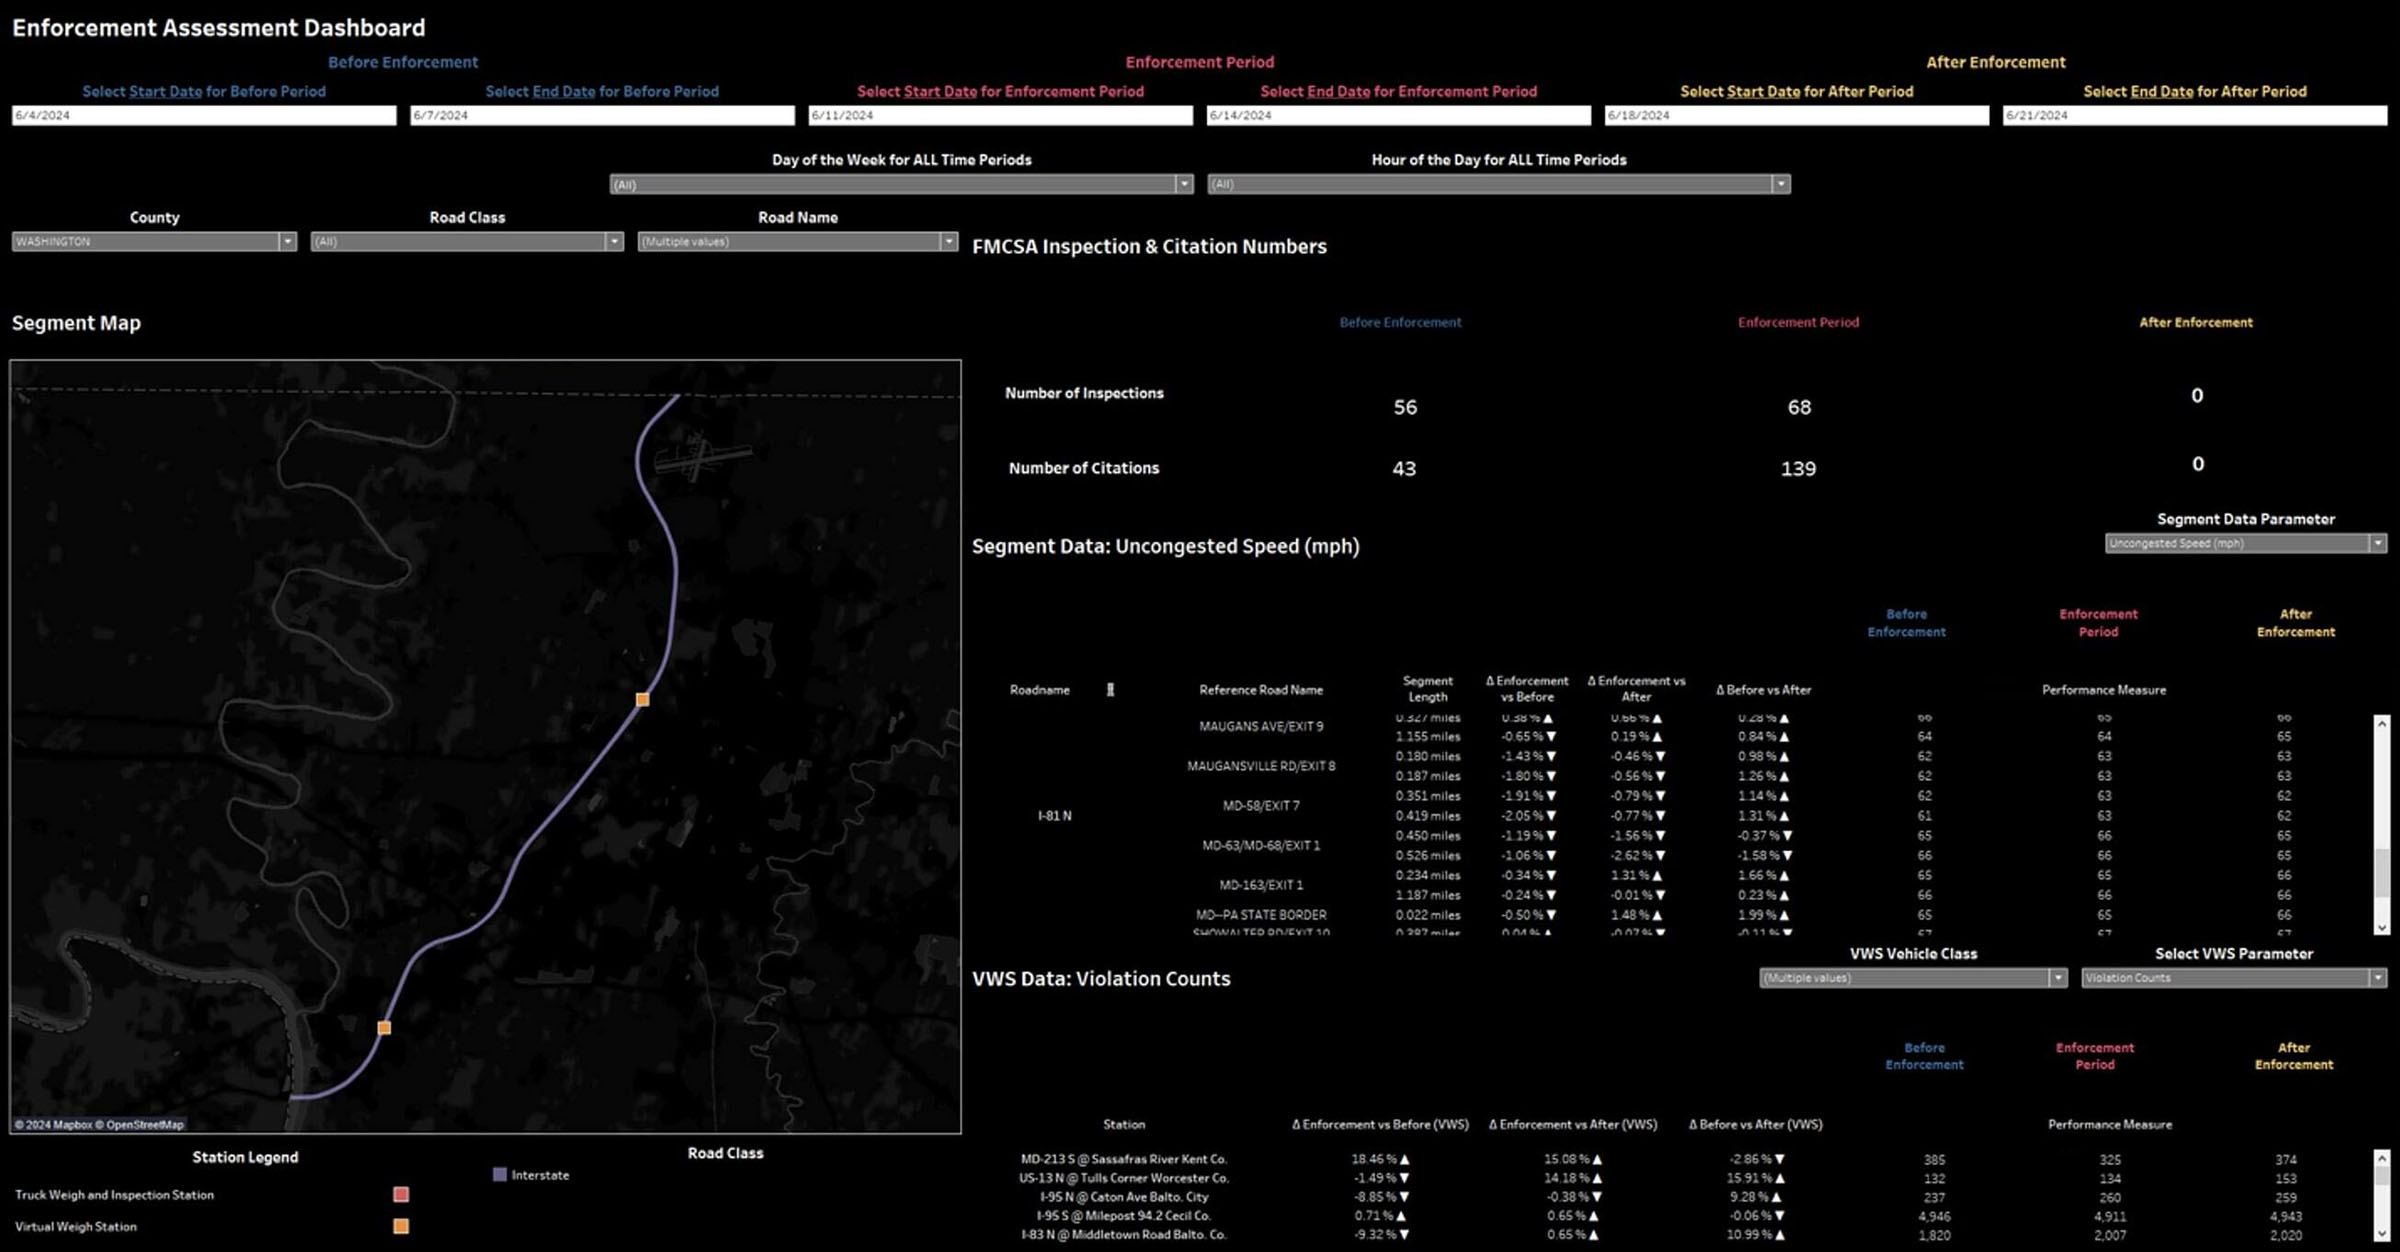
Safety Explorer: Enforcement Assessment Dashboard
The Enforcement Assessment Dashboard allows agencies to compare the effectiveness of enforcement activities in reducing the number of future citations. In some cases, enforcement blitzes can cause a “halo effect”, where the number of citations issued immediately afterward can go down, as drivers temporarily adopt safer driving behavior. The Enforcement Assessment Dashboard lets users pick date ranges before, during, and after the enforcement period and compare the number of inspections and citations issued during those periods. The dashboard also compares the average speed along roadway segments and the difference in average speed at virtual weigh stations to see if the halo affect extends more generally to overall highway speeds as well.