Weather is an important contributing factor in roadway congestion and, often, collisions. To help agencies better understand those impacts, RITIS is now spatially overlaying observed precipitation and precipitation-rate data from the NOAA National Weather Service directly within advanced Probe Data Analytics Suite data visualizations.
This innovation gives users additional context to better understand how weather may contribute to or influence traffic conditions over time. Rather than relying only on traffic data or general weather assumptions, agencies can now view observed precipitation, precipitation rates, and related atmospheric events such as dust storms alongside probe-based speeds, delays, and travel times in the same spatial and temporal context. This helps users evaluate not only where weather events occurred, but also their intensity, making it easier to assess possible relationships between weather, congestion, and roadway safety impacts.
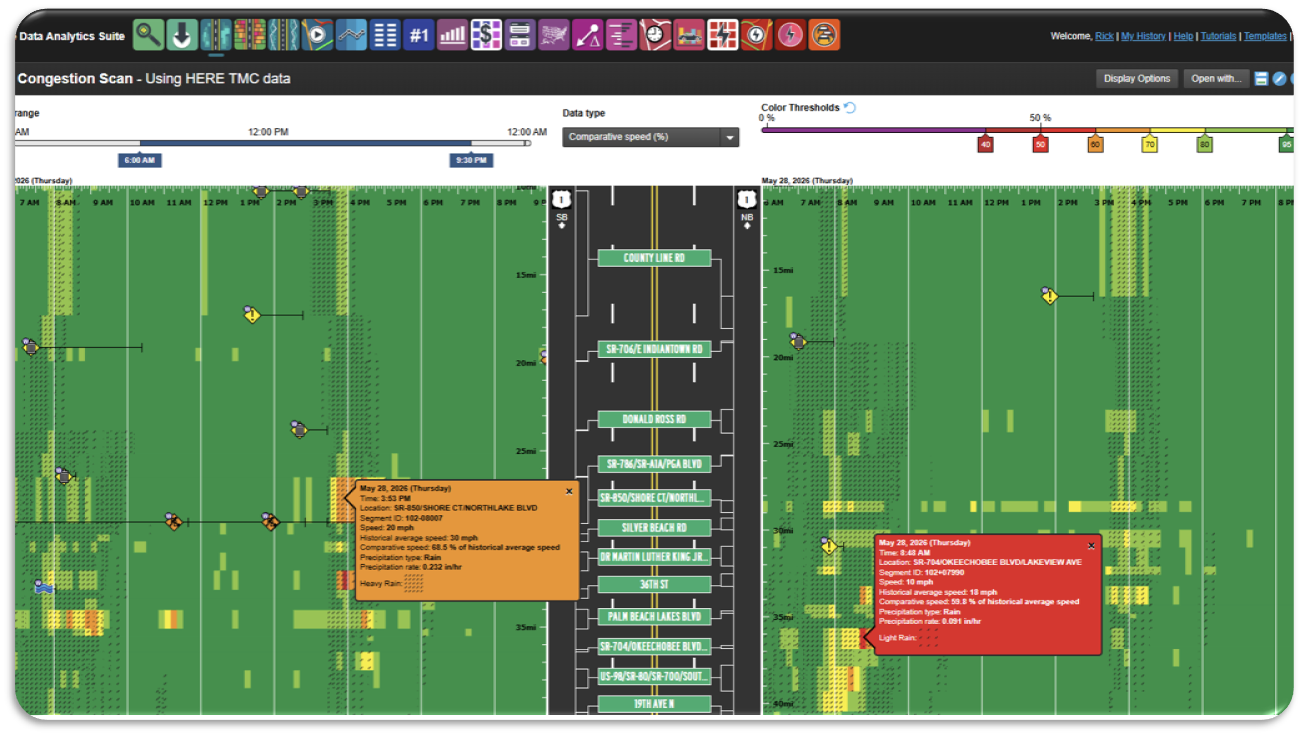
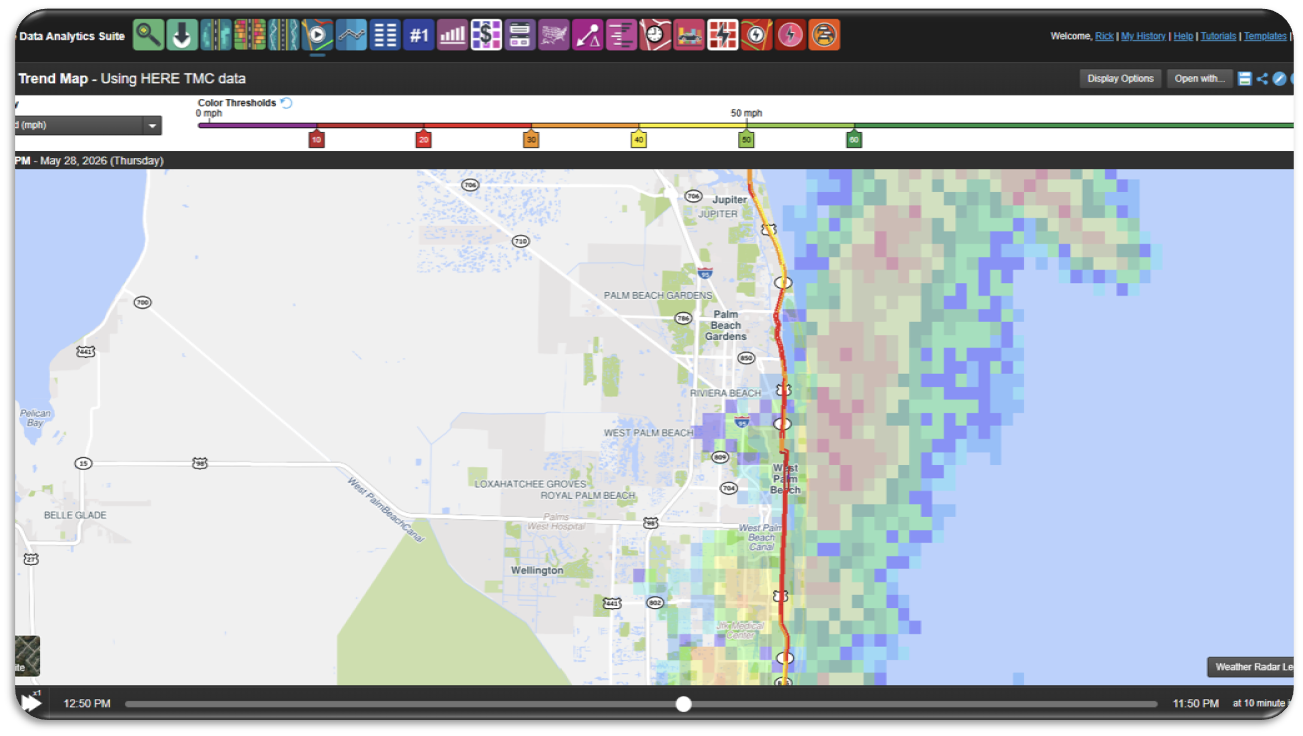
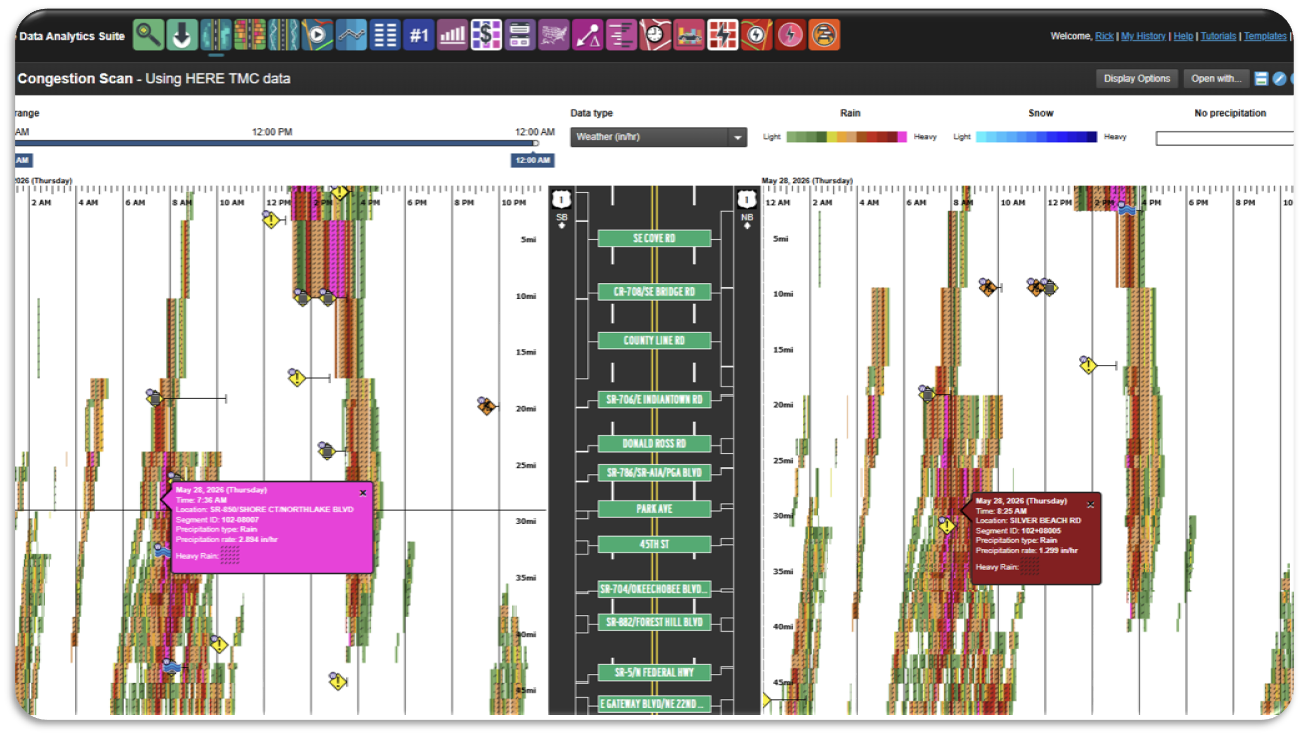
Archived NOAA National Weather Service weather data is now available in Congestion Scan, Trend Map, and Region Explorer. In Congestion Scan, users can compare observed precipitation and rate with corridor performance. In Trend Map, users can view an animated representation of precipitation over time, making it easier to see how weather moved through a region and how traffic conditions changed in response. Region Explorer provides another way to evaluate precipitation-related impacts across a selected geography, date, and time.
By spatially overlaying observed weather data into PDA data visualizations, RITIS is providing an innovative and industry-unique way to connect weather, congestion, and roadway safety. This added context can help operations, planning, safety, and maintenance teams identify weather-sensitive corridors, better understand recurring impacts, and make more informed decisions.
