PDA: The Probe Data Analytics Suite

The Probe Data Analytics Suite allows agencies to support operations, planning, analysis, research, and performance measures generation using probe data mixed with other agency transportation data.
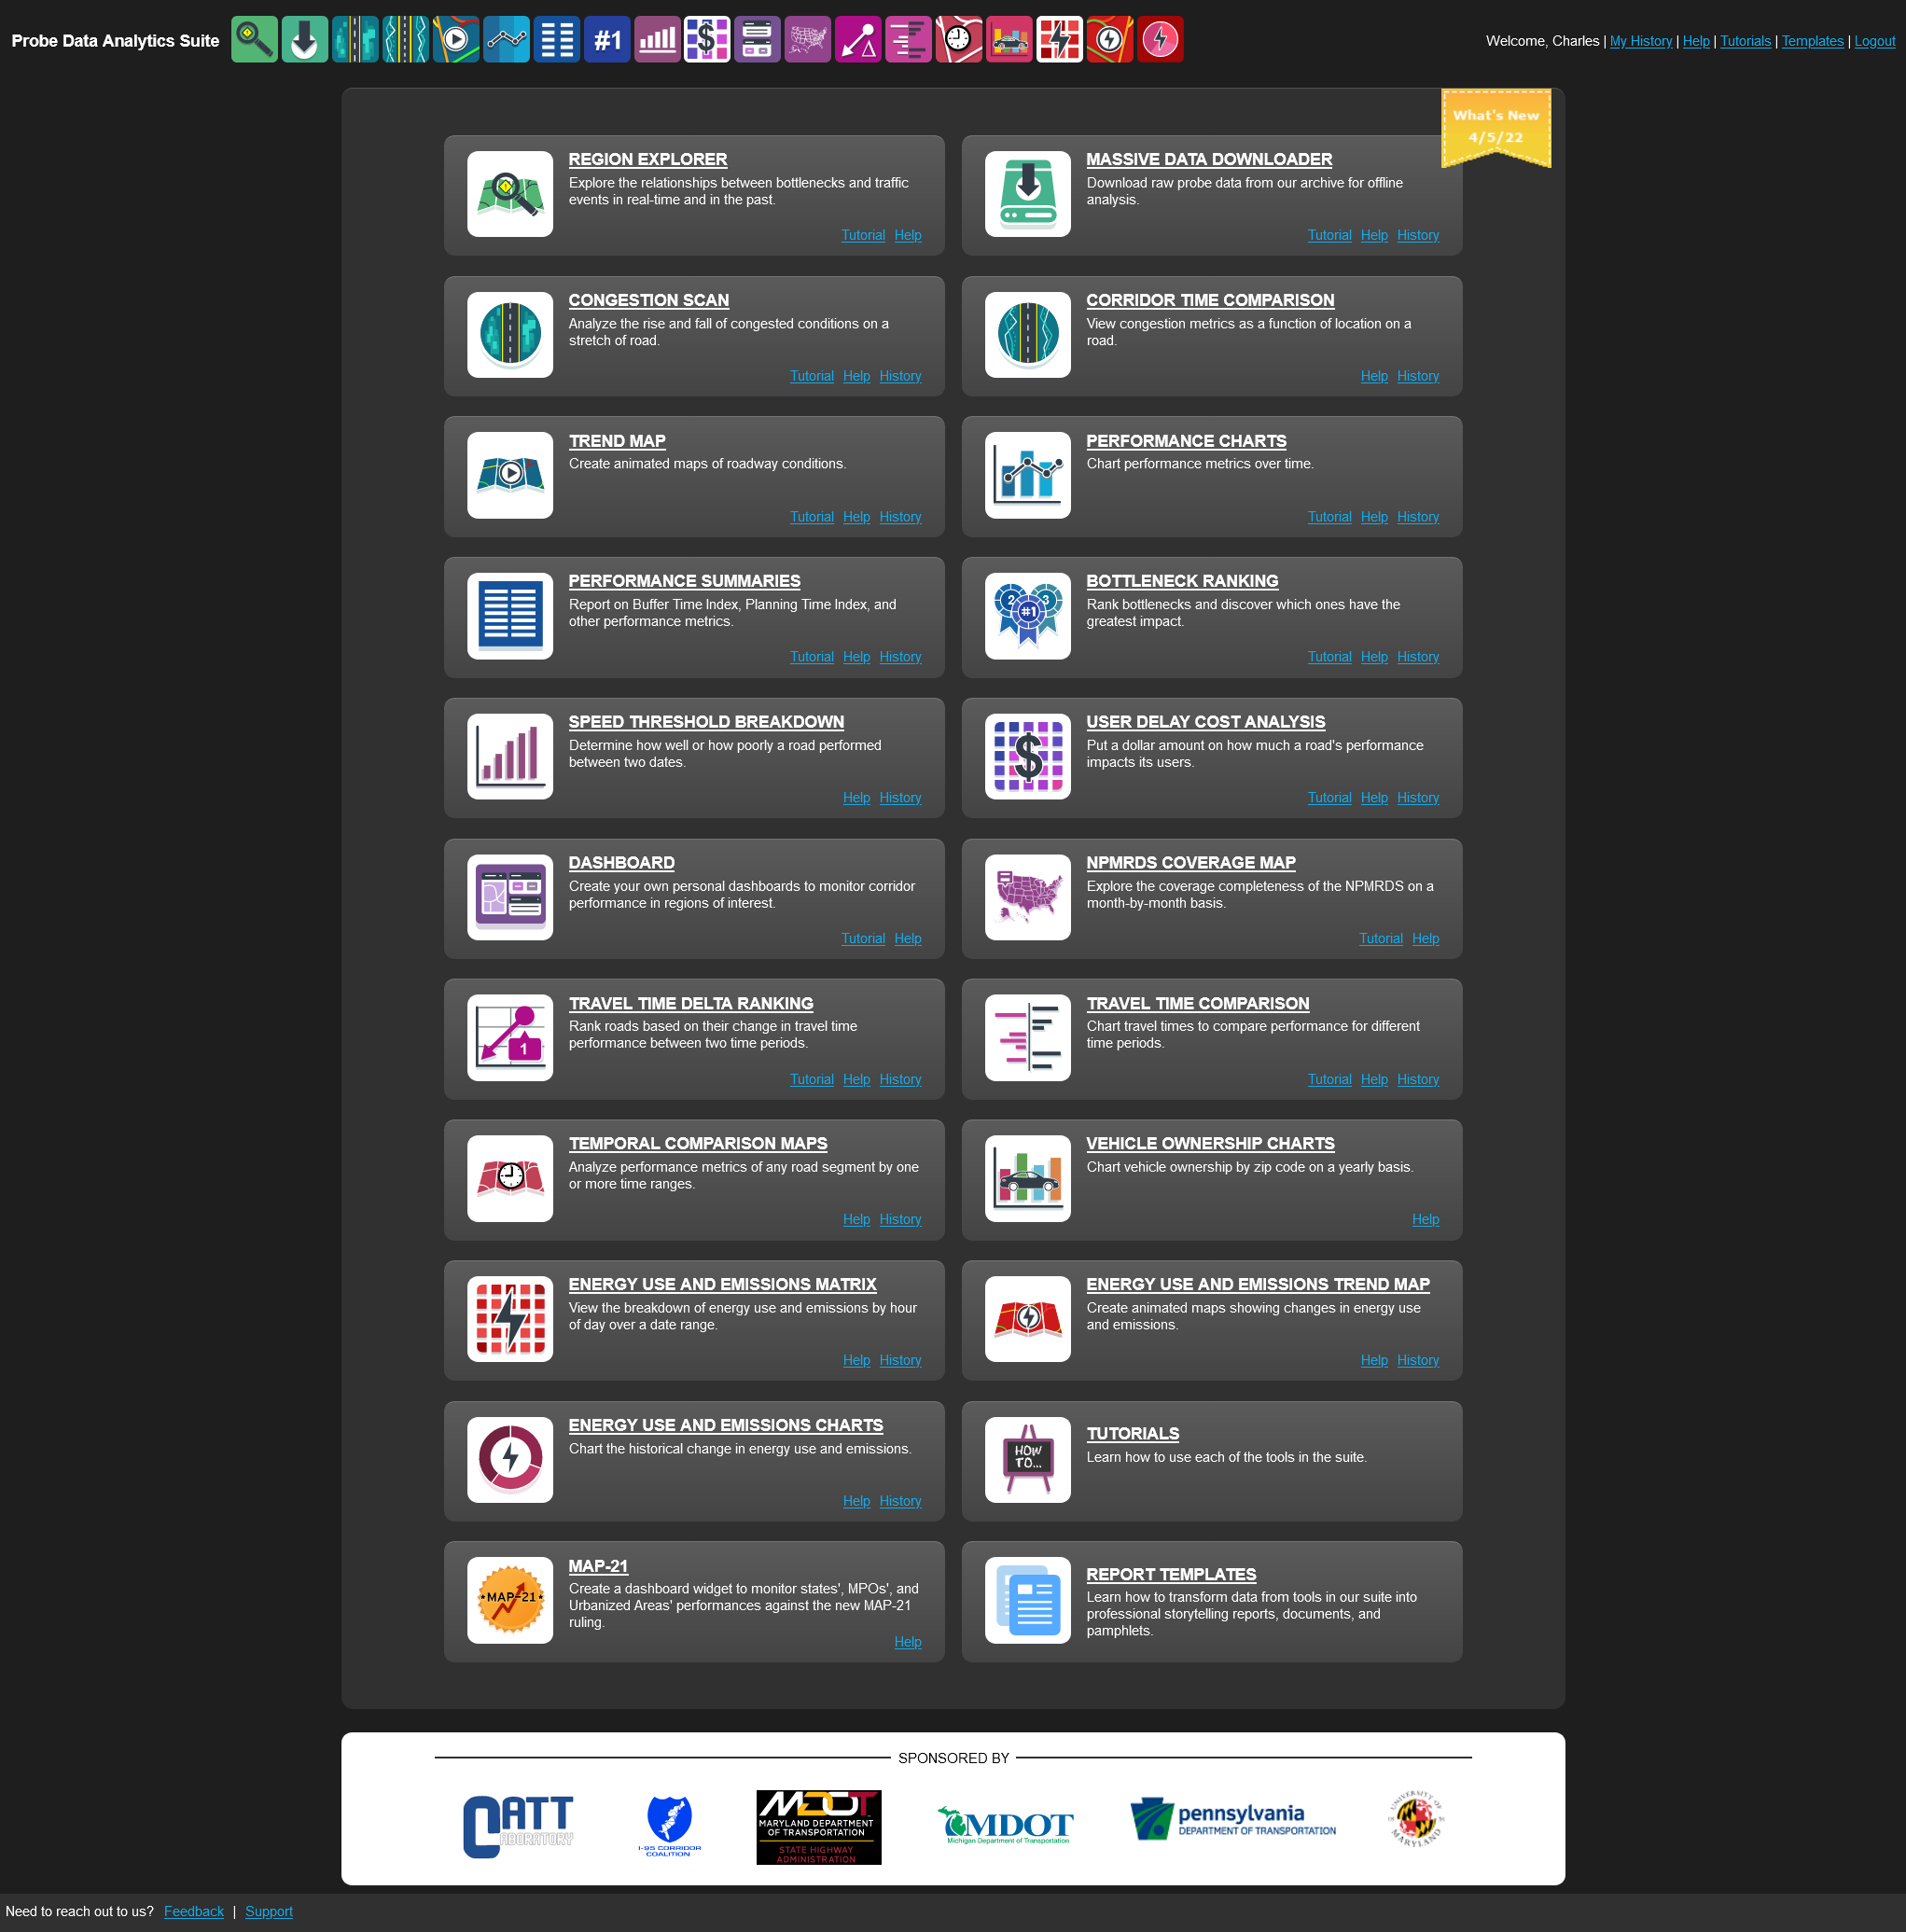
The suite consists of a collection of data visualization and retrieval tools. These web-based tools allow users to download reports, visualize data on maps or in other interactive graphics, and even download raw data for off-line analysis. Each tool has its own unique purposes. Among many other uses, the Probe Data Analytics Suite can provide insight on:
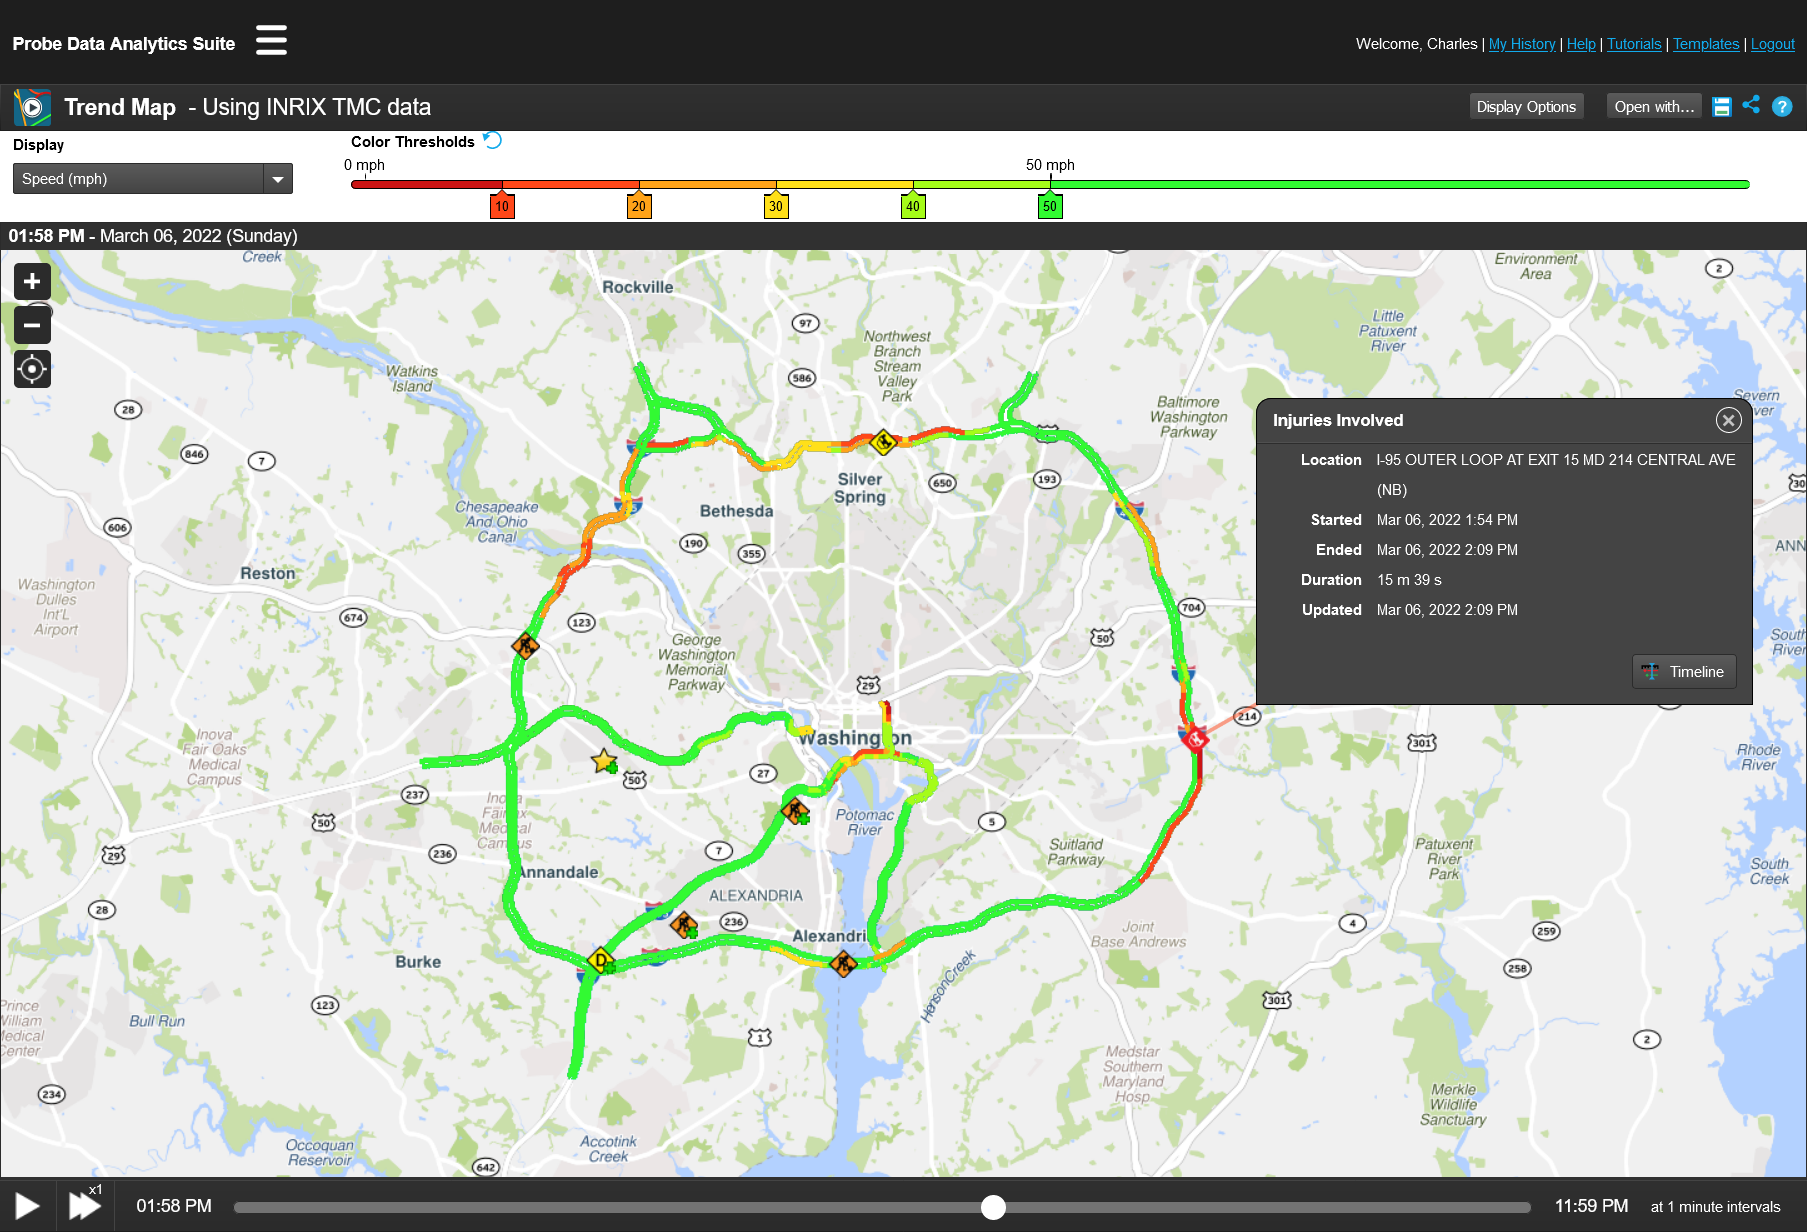
Dashboard
The dashboard can be used to explore the impacts of bottlenecks and incidents along a road. A bottleneck is defined as a portion of the road whose speed falls below 60% of the normal speed for five minutes. The bottleneck and incident information can be viewed in real-time or at a previous point in time.

Massive Raw Data Downloader
All of the raw probe speed data given to the CATT Lab can be downloaded using the Massive Raw Data Downloader tool. This allows for more a personalized use of CATT Lab’s resources, giving the user the ability to inject this raw data into their own applications. This tool allows for any date range of data, so the resulting files can be enormous in size!
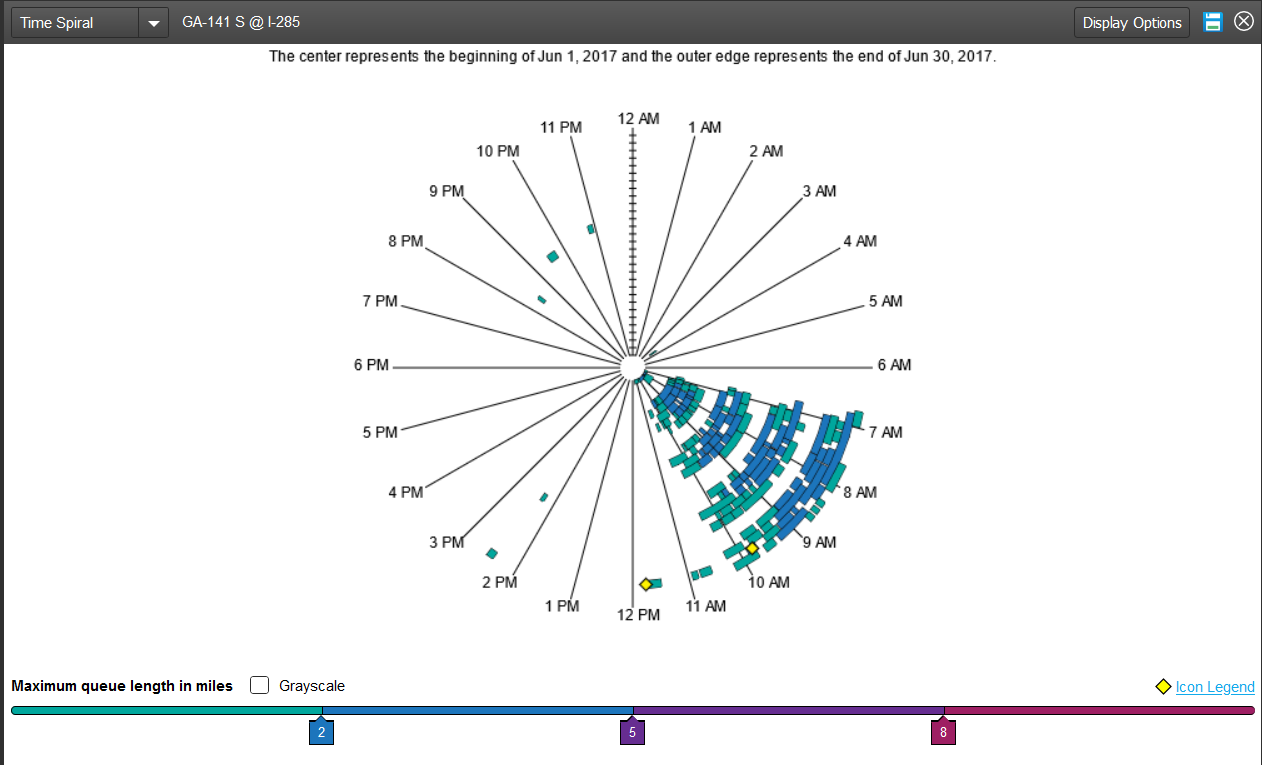
Congestion Scan
Whenever an incident happens on the road, or if a busy portion of the road is under construction, congestion will most likely occur. Getting a grasp on how long this congestion has been affecting a road and its drivers commute is not easy to do when simply looking at numbers. The Congestion Scan takes this information and turns it into a robust visualization which allows for detailed exploration of the congestion occurrence.

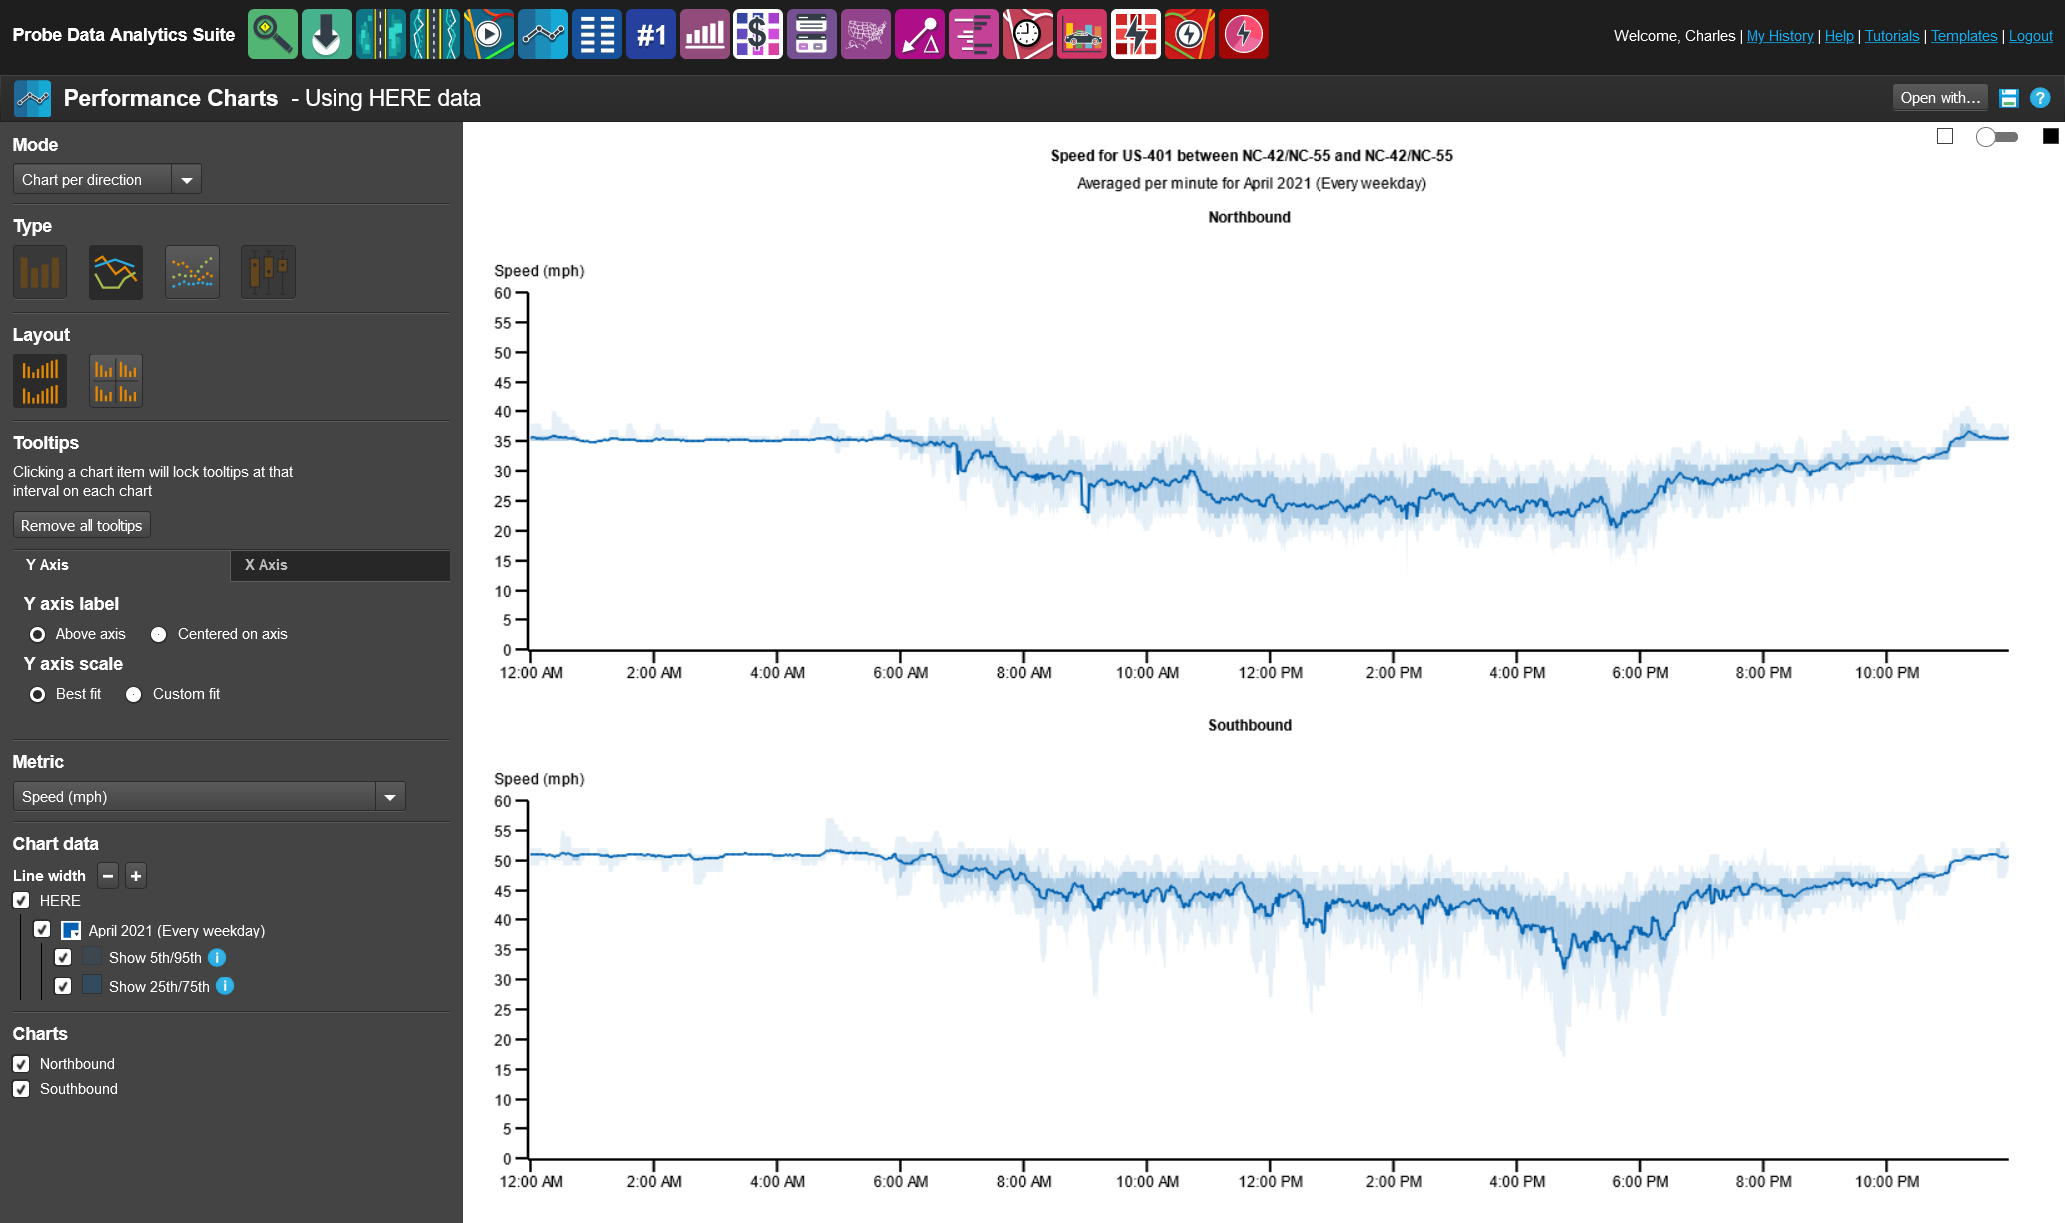
Historic Probe Data Explorer
The Historic Probe Data Explorer is a collection of visualizations that provide insight on trends and patterns of traffic conditions over given date ranges. This tool can be used to compare normal, everyday traffic patterns on a road to a single day (a holiday or even a day when a natural disaster occurred) and show how this day’s traffic patterns varied from the normal.
Bottleneck Ranking
Using the information shown in the Dashboard (mainly the bottlenecks), this tool gathers all bottlenecks found within a specified date range along a corridor and rank the bottlenecked portions of the road based on either the number of occurrences found, the queue size, or the duration of the bottlenecks. This tool allows for quick and easy identification of commonly congested roads.
The Probe Data Analytics Suite is constantly under development through funding from participating member agencies, so users can expect to see frequent updates to functionality and usability.
Numerous tutorials for the Probe Data Analytics platform can be found at the following location: https://www.ritis.org/tutorials/