4D Virtual Globe
The advancement of automated data reporting technologies has supplied us with virtually boundless real-time geospatial information. It is becoming more common now for public and private sectors to provide access to data in their respective fields. Even though countless visualization tools have been developed to archive, explore, and analyze this data, understanding the relationship between multiple data sources is still a complex process; even more so with real-time geospatial data.
he 4D Virtual Globe application is an initiative effort by the CATT Lab to weave real-time geospatial data from different sources into one coherent big picture. This visualization tool has been developed to provide incident management personnel, emergency management personnel, and the general public with the means to achieve situational awareness in as close to a real-world setting as possible.
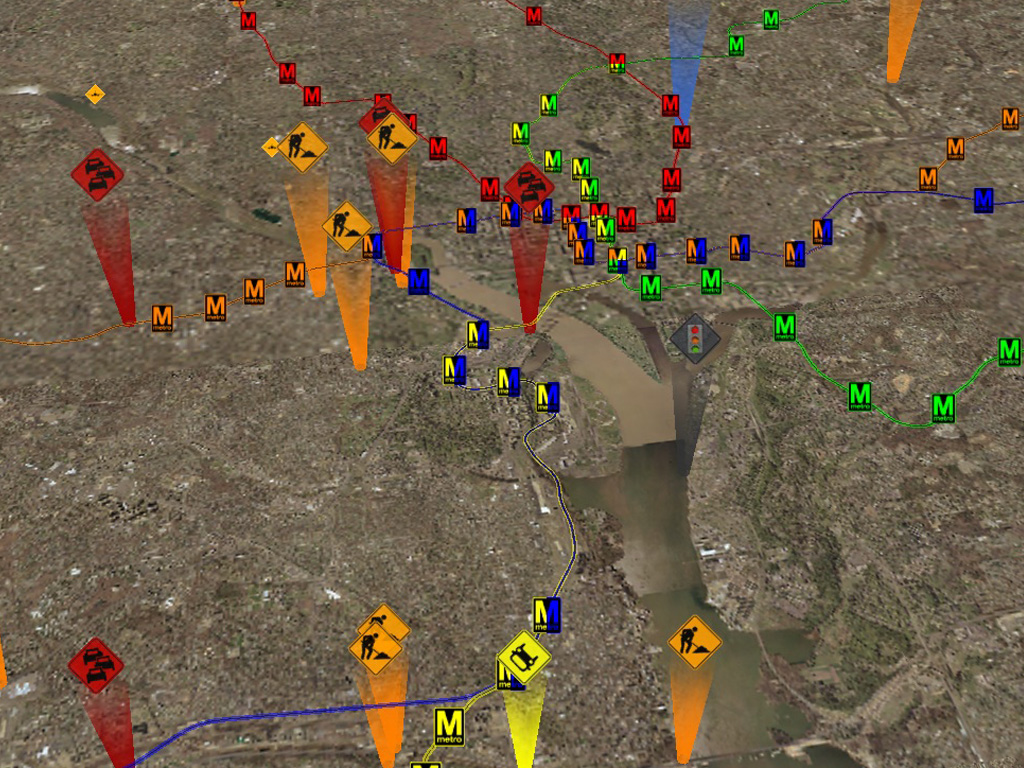
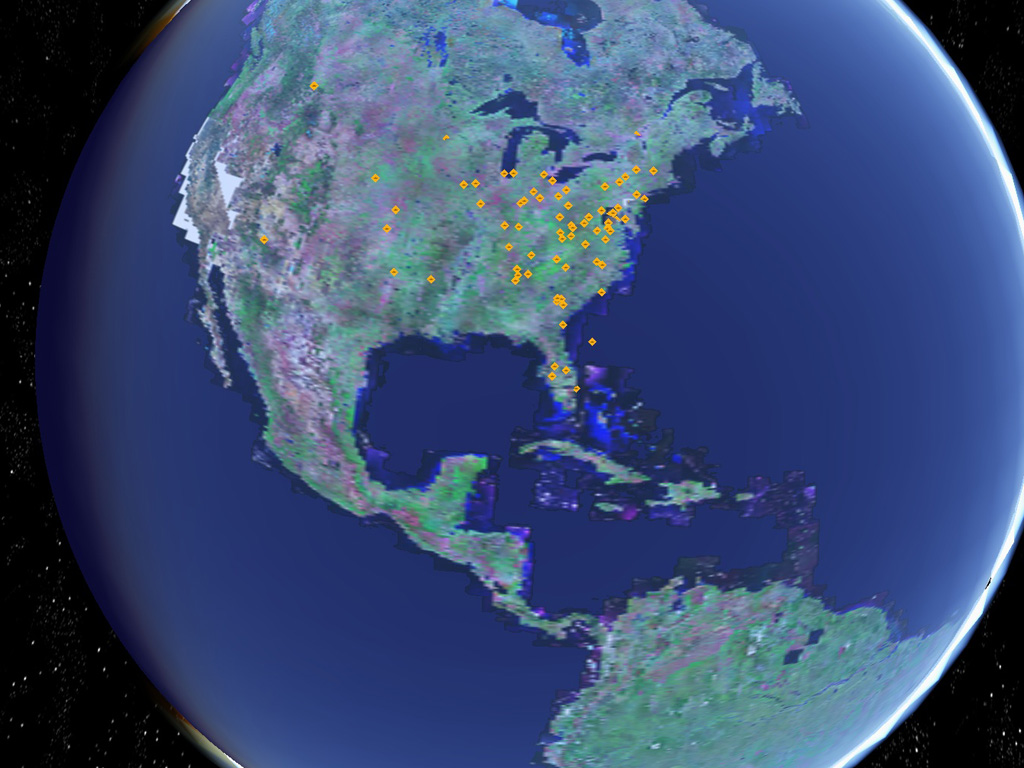
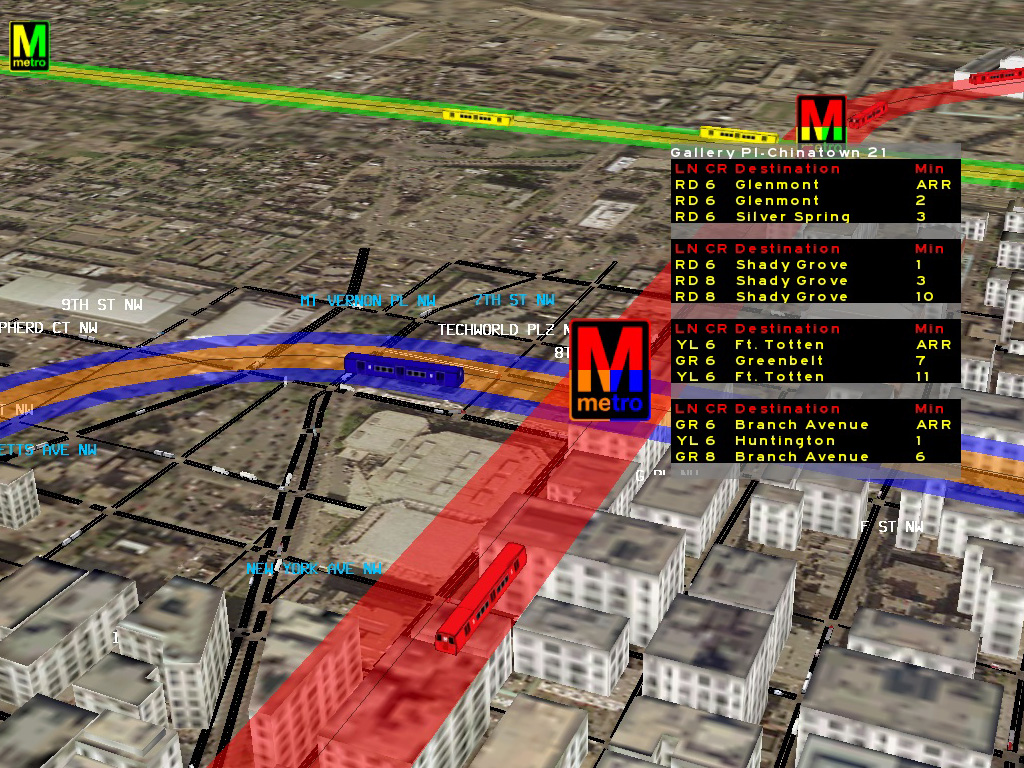
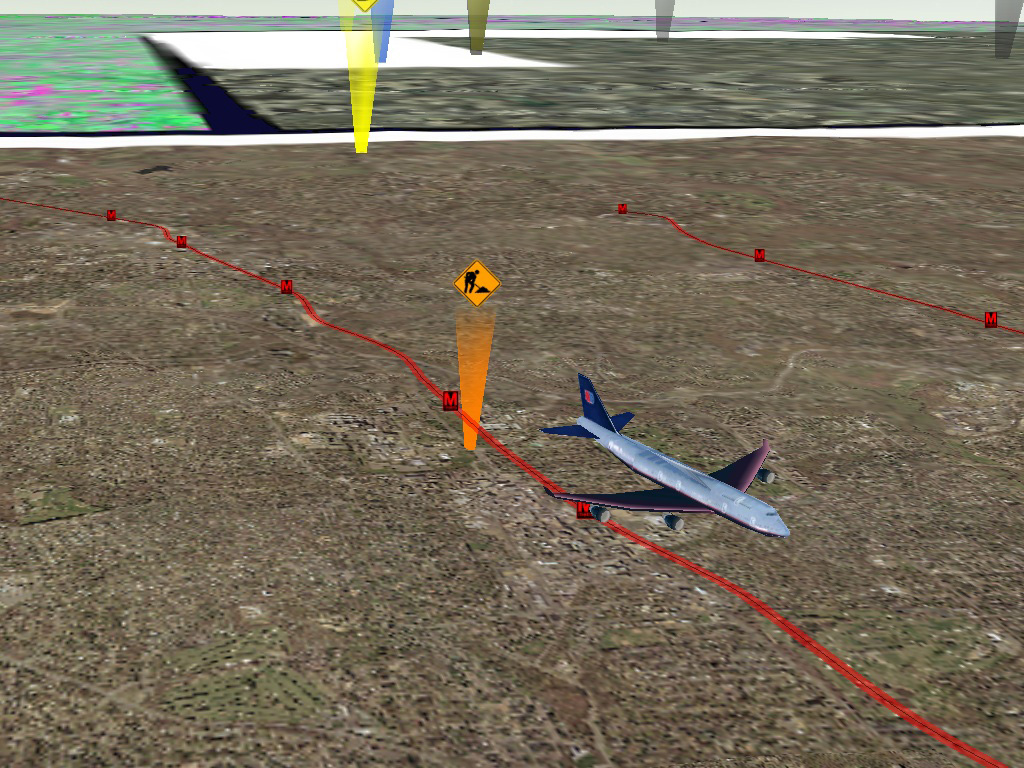
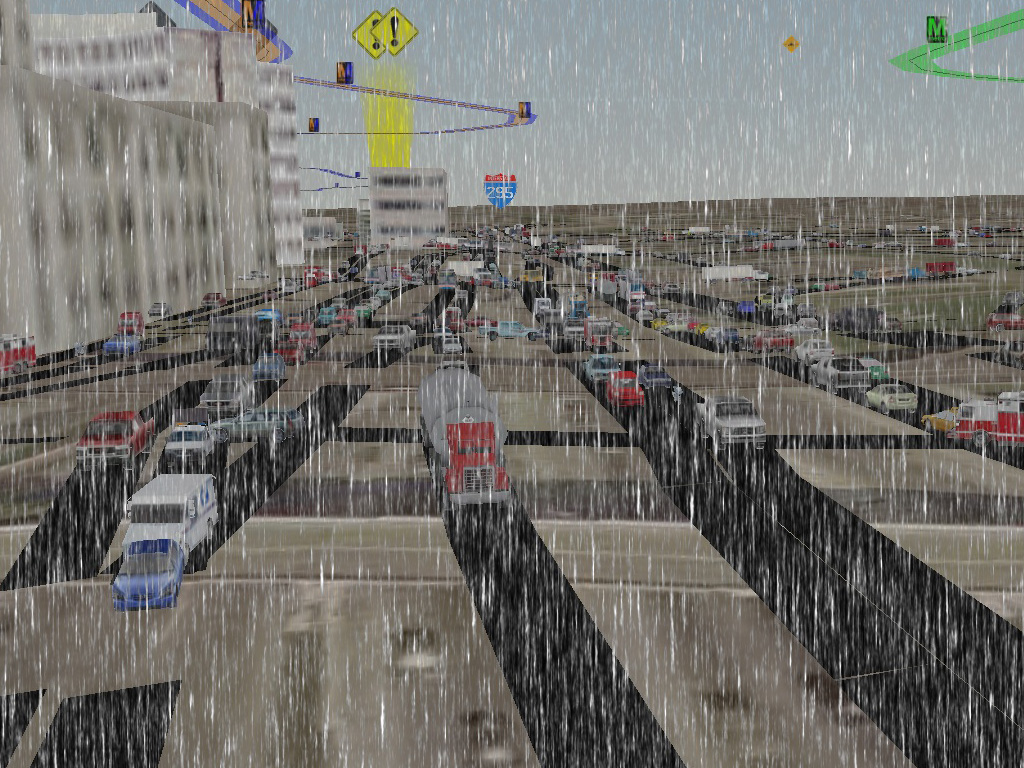
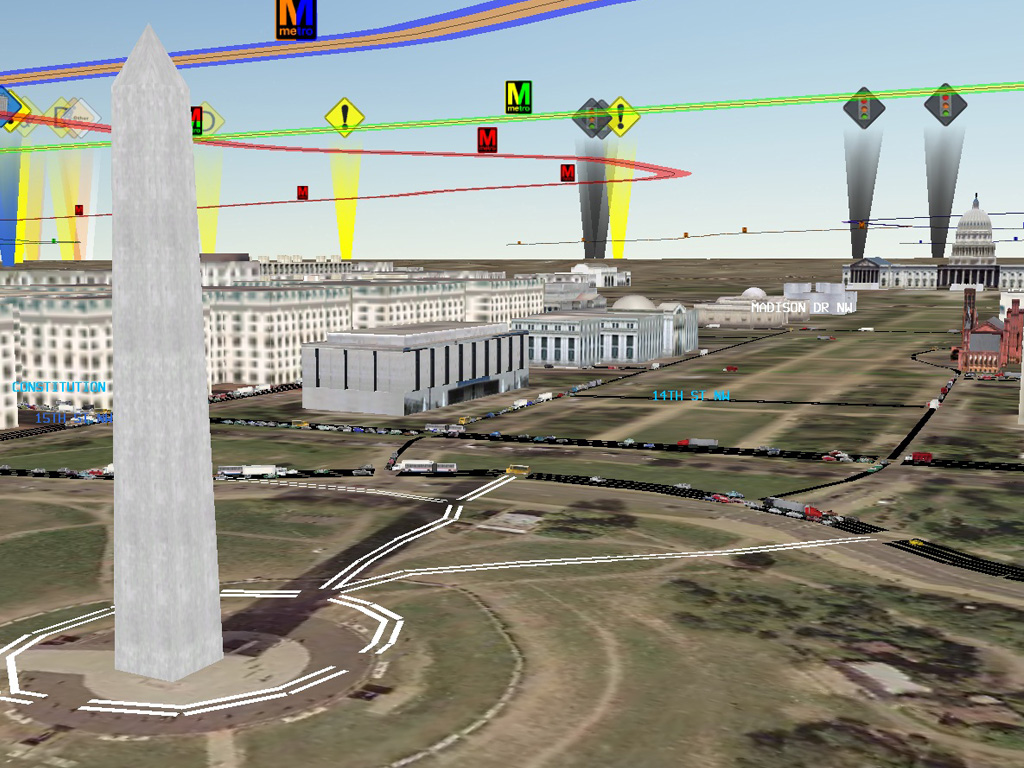
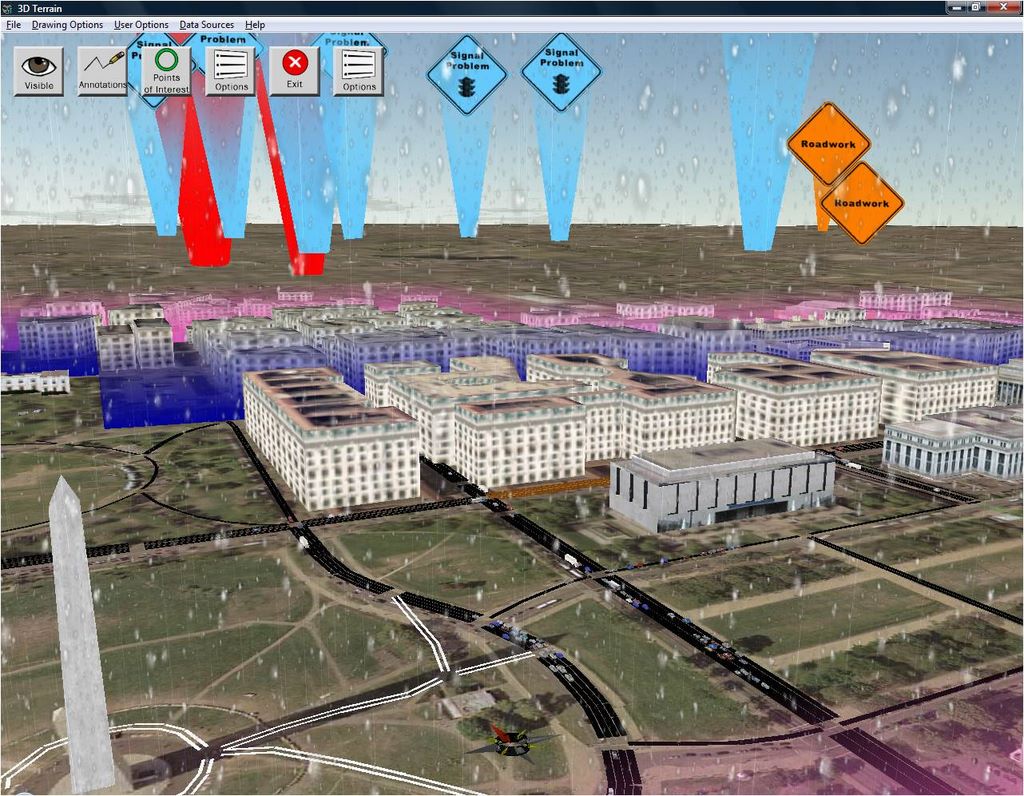
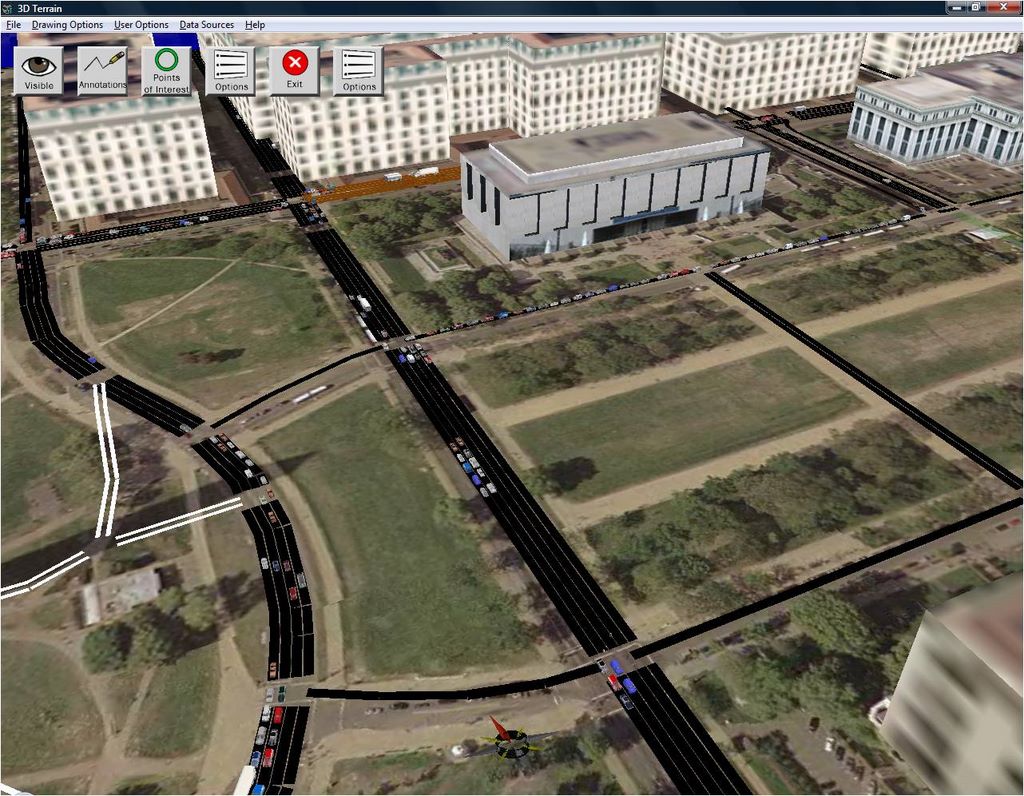
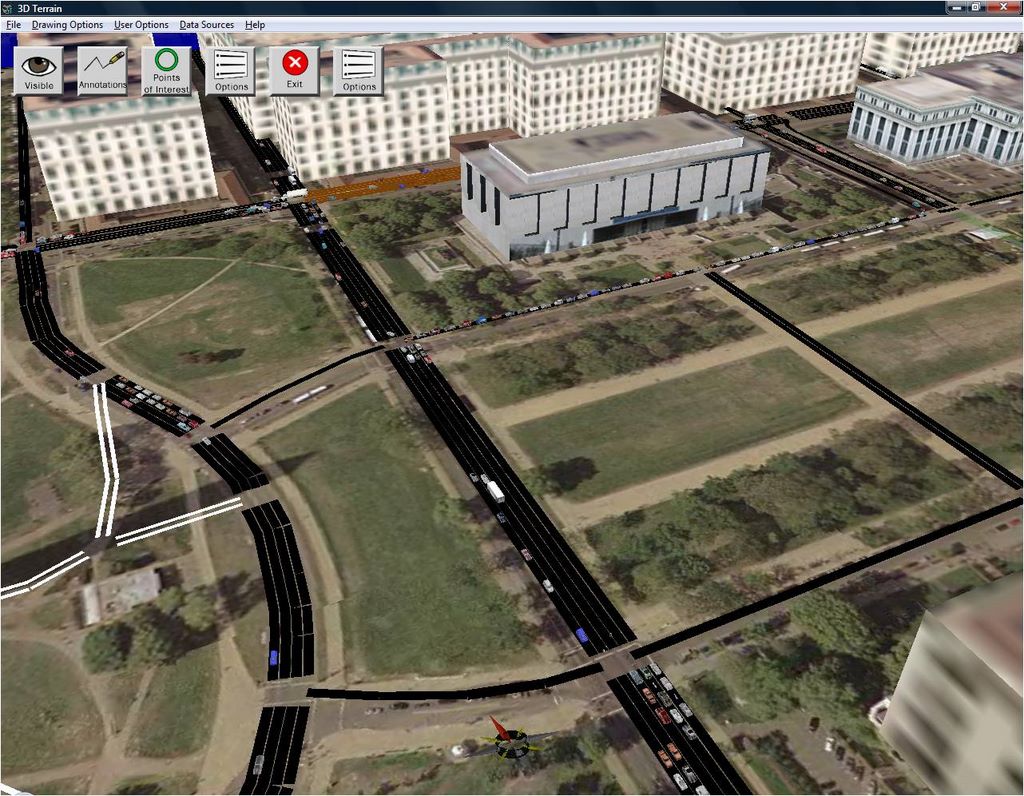
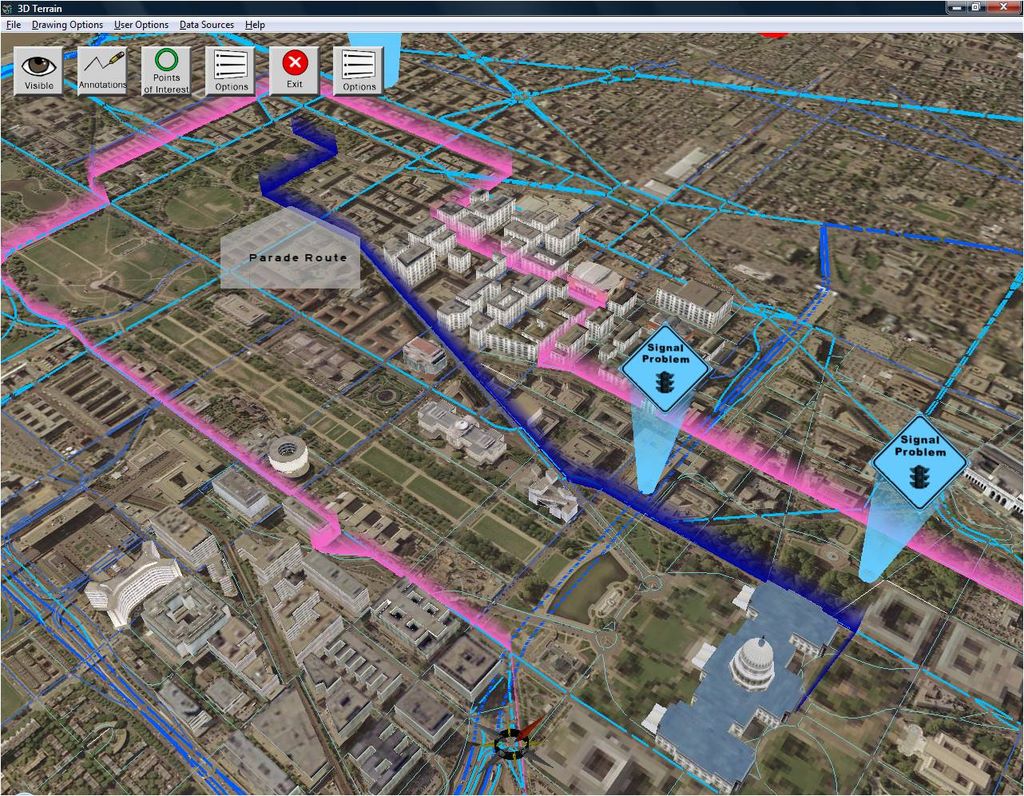
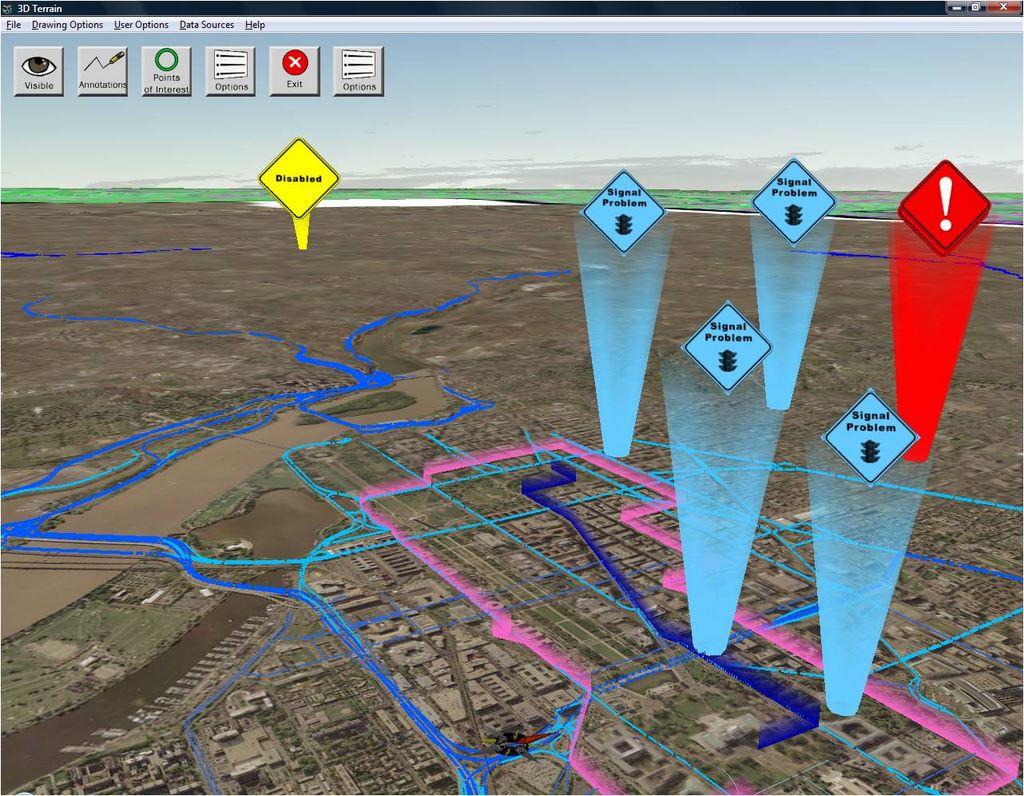
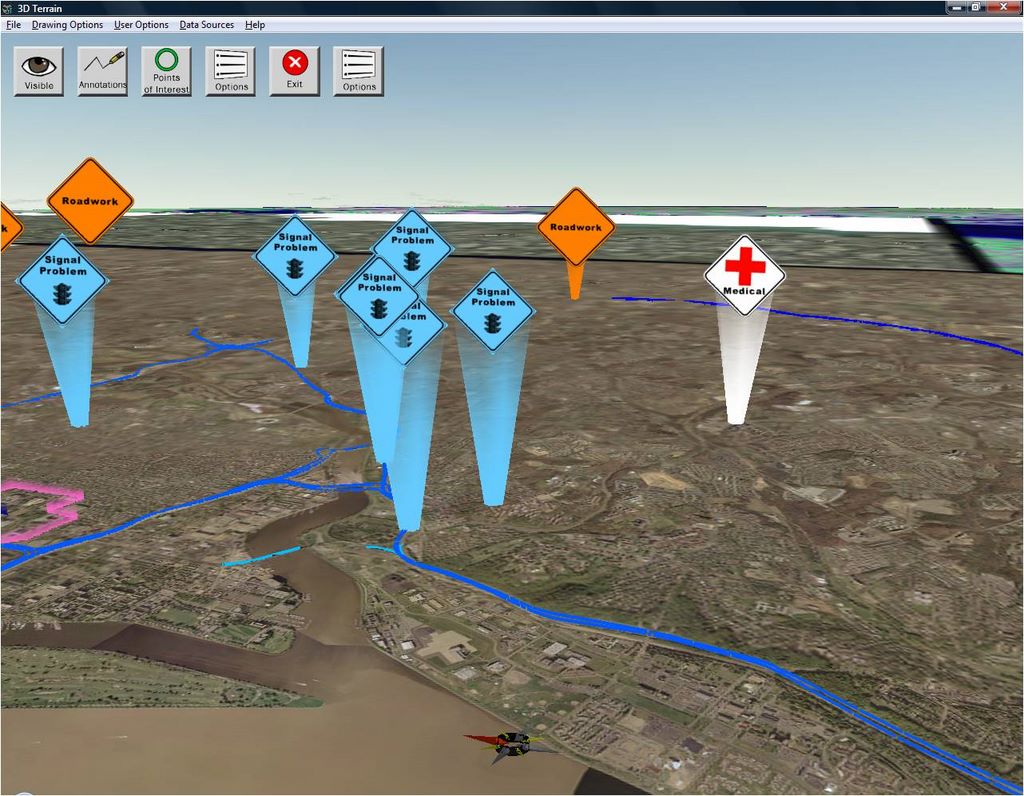
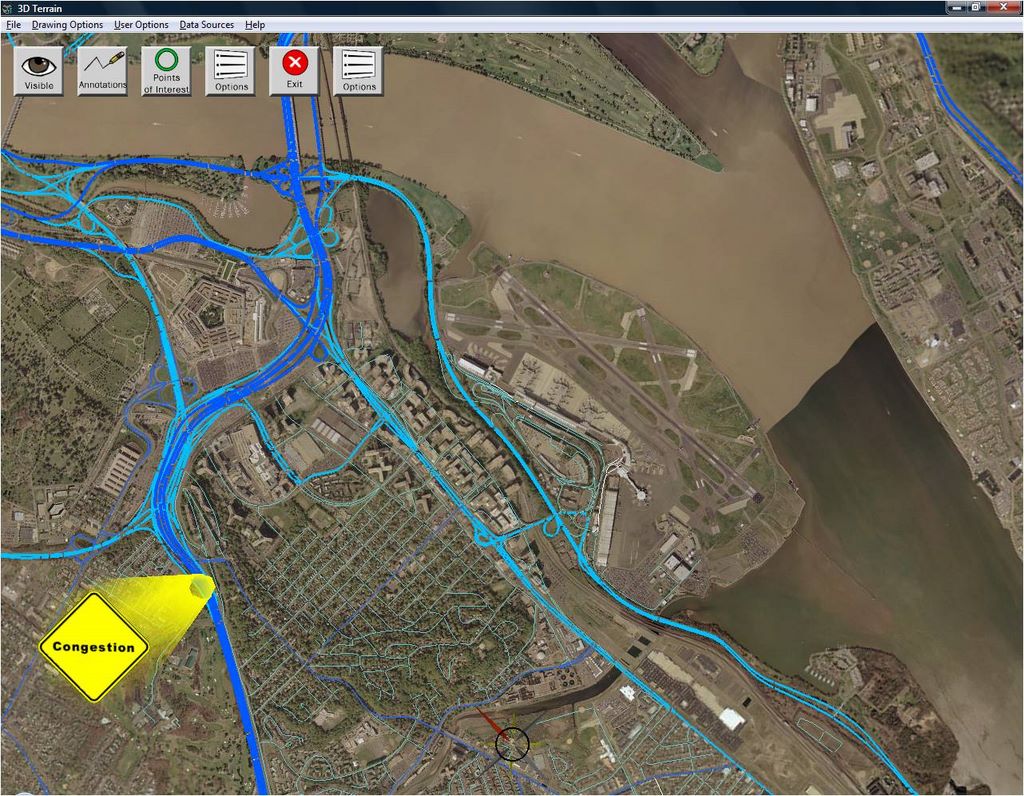
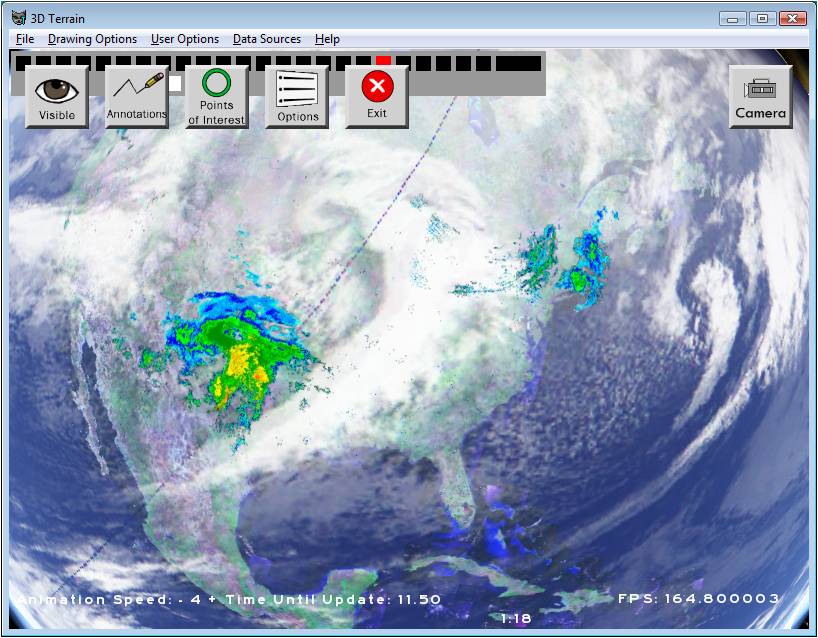
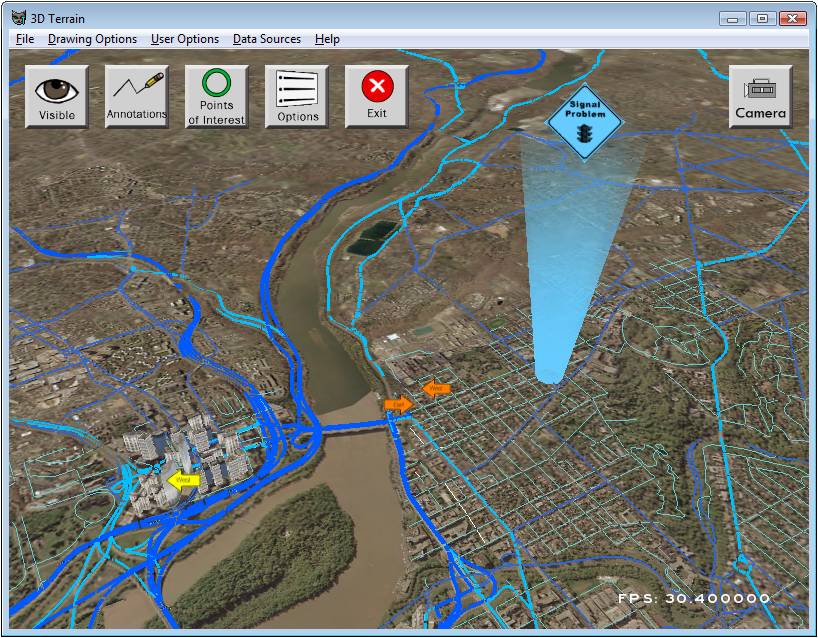
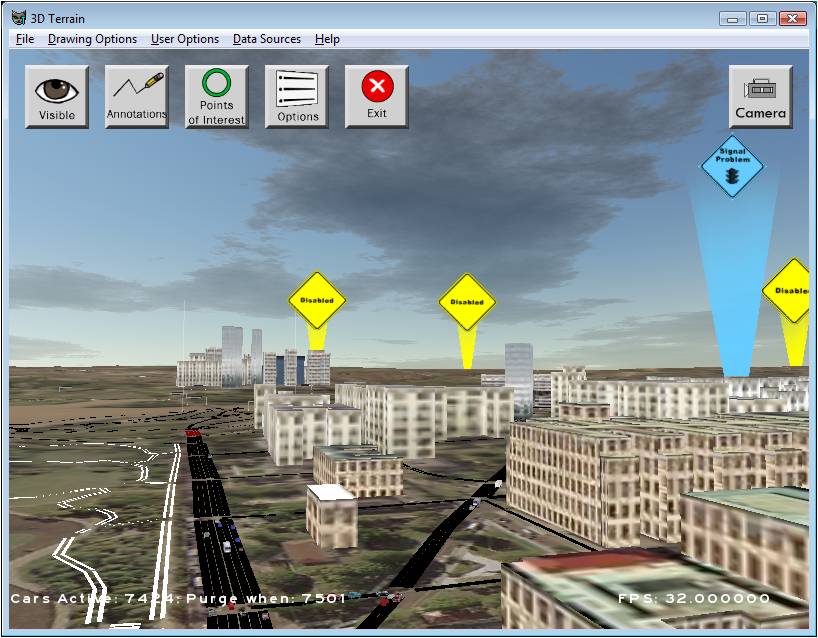
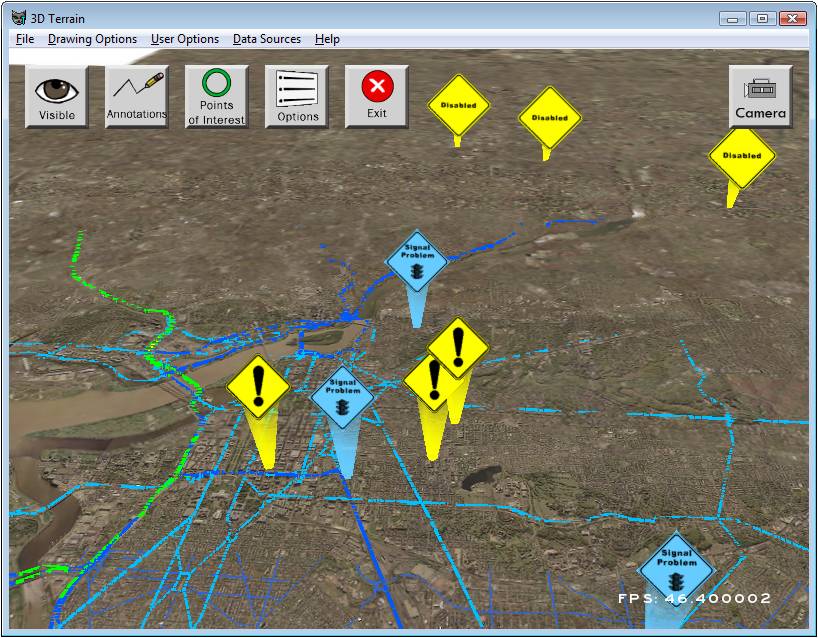
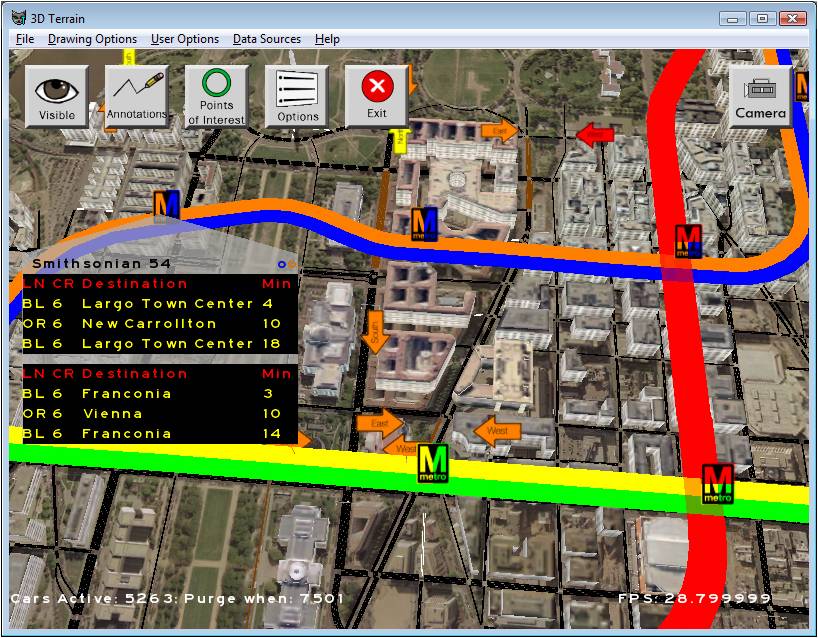
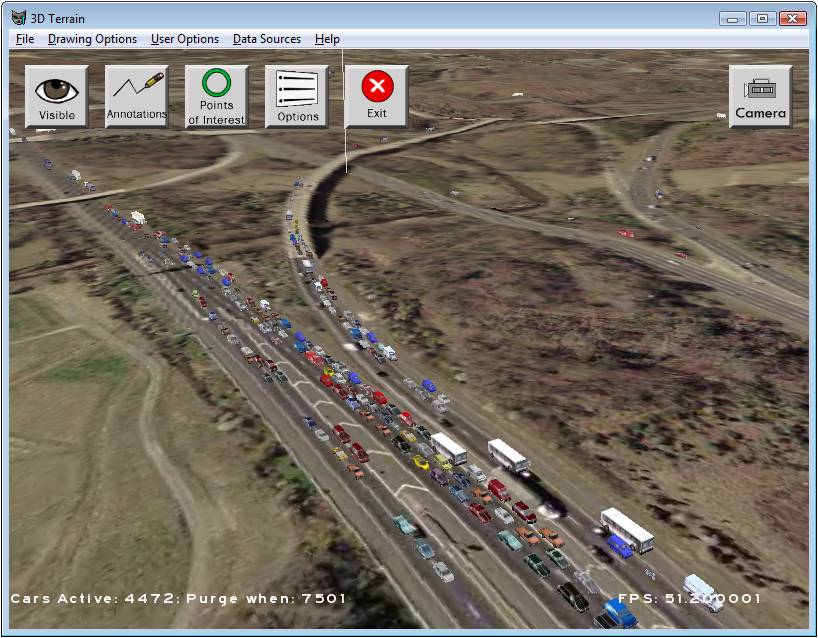
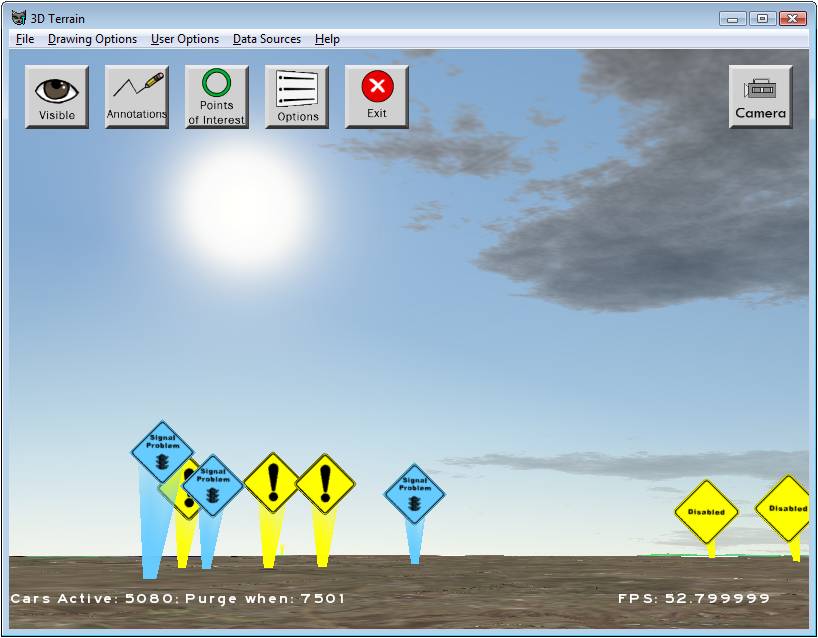
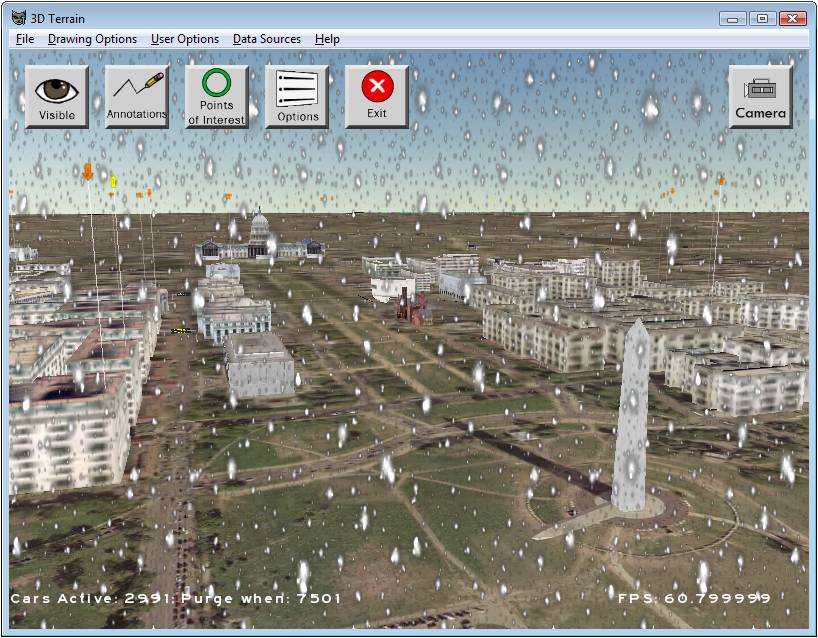
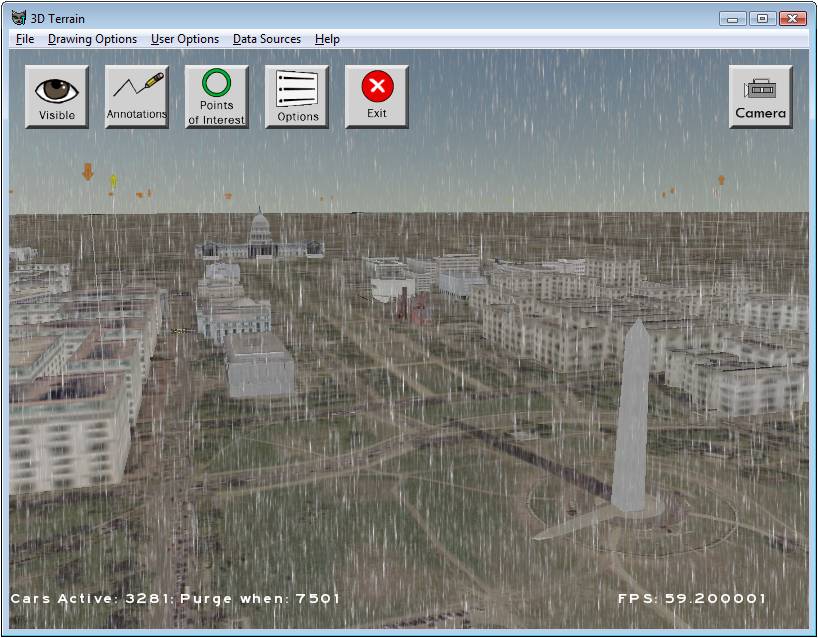
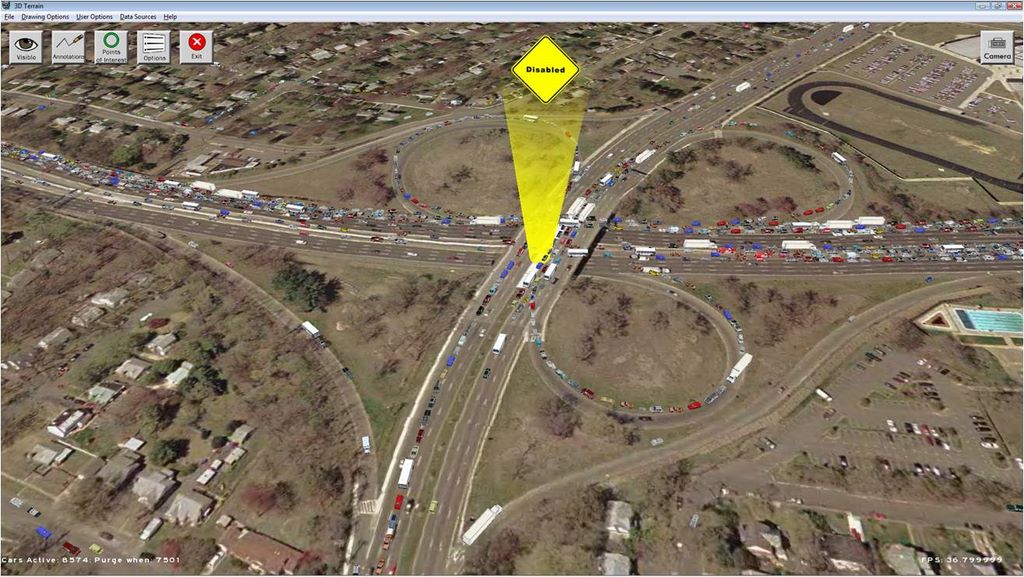
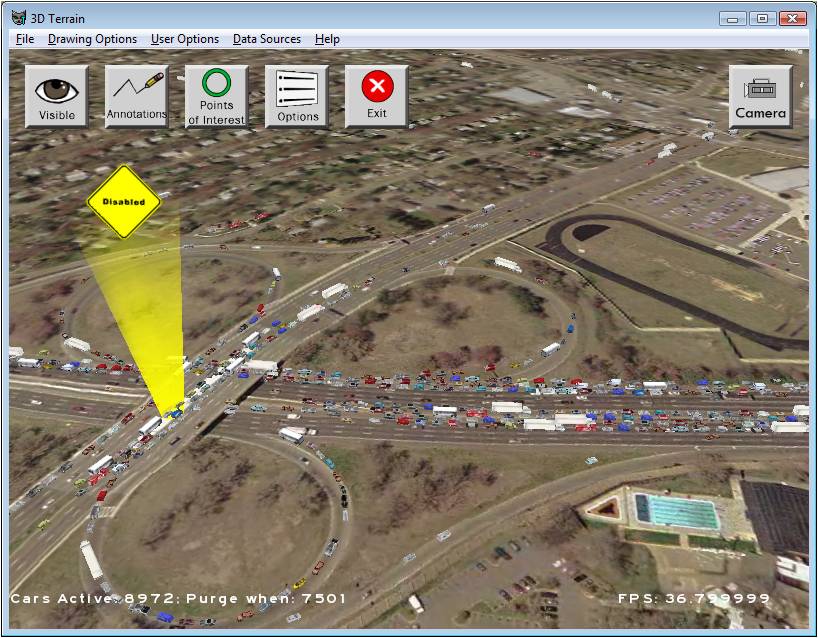
This effort employed a combination of advance computer graphic, 3D modeling, server, network, and various optimization techniques to develop a scalable, highly interactive Virtual Globe using available GIS and transportation infrastructure data in conjunction with thousands of real-time traffic sensors, transit, and accident data. The system interacts with real-time traffic databases to show animations of flowing traffic, incident, and weather data. A user can zoom through a region to inspect conditions at an infinite number of angles and distances. The program also allows users to monitor the status of and interact with traffic control devices such as dynamic message signs, CCTV feeds, traffic sensors, and even view the location of a fleet of vehicles equipped with GPS transponders.
While often described as “Google Earth on Steroids” the system was designed and coded from scratch by CATT Lab’s researchers. This system was used by FEMA during the inauguration of President Obama to manage traffic in and out of the city and to monitor the parade route and security zones in real-time.