
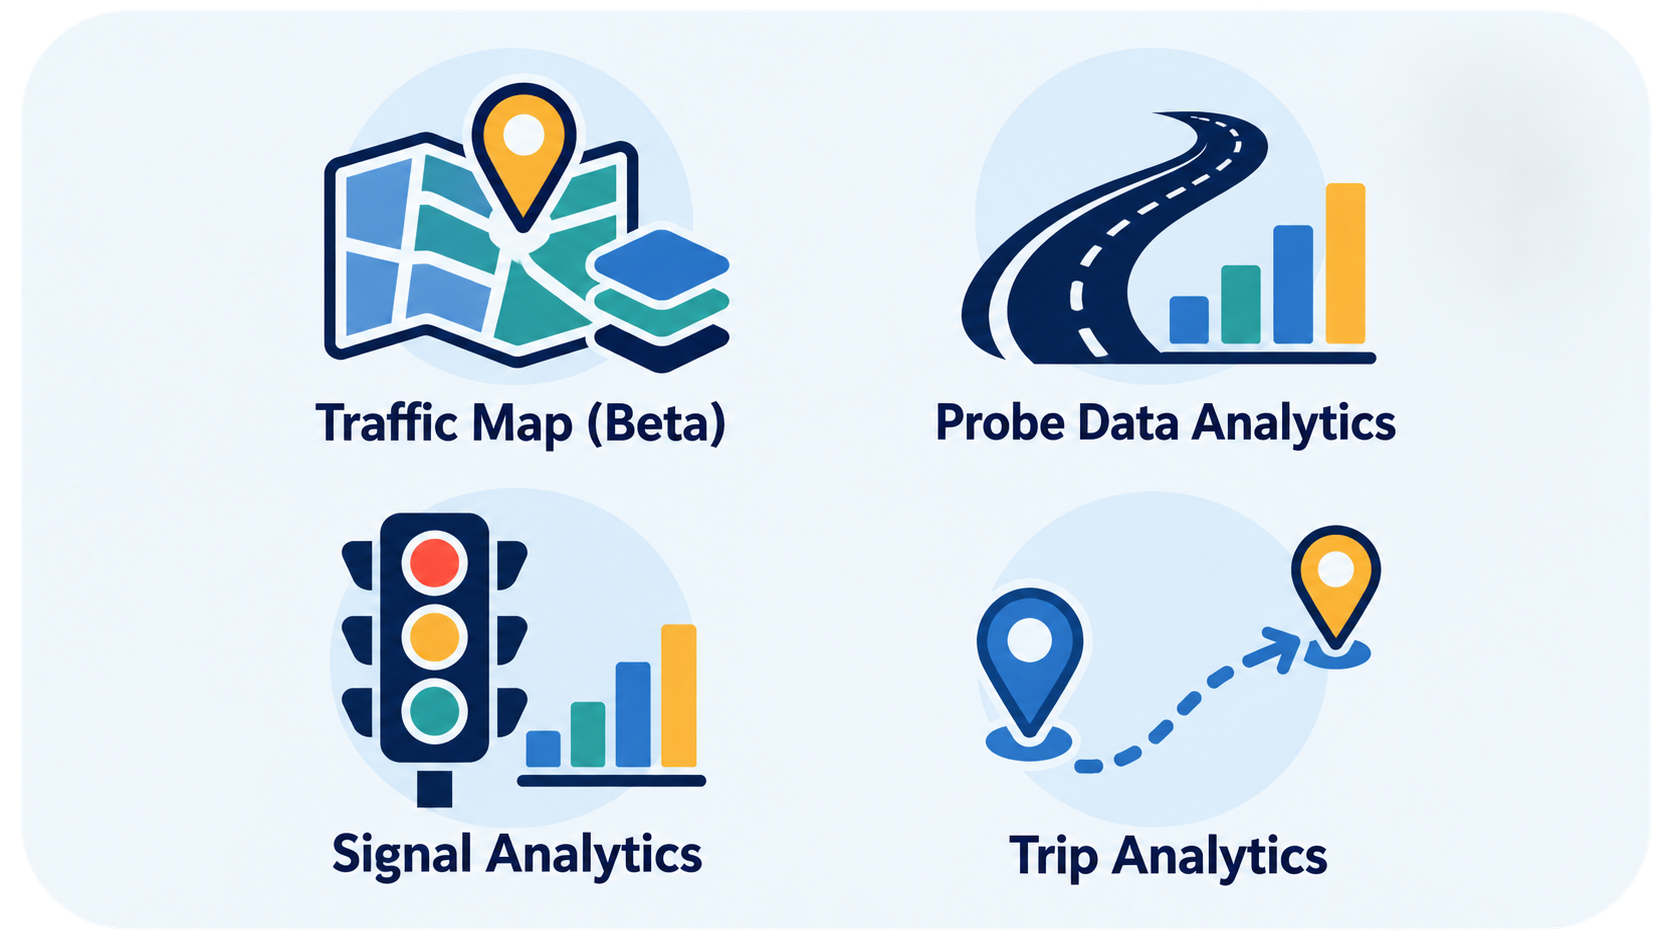
From new map layers to improved reports, recent RITIS updates give you more ways to explore transportation conditions and share your findings. Here are some highlights from Traffic Map (Beta), Probe Data Analytics, Signal Analytics, and Trip Analytics.
Traffic Map (Beta)
- Explore weather and planned events. The new Weather Conditions layer replaces Weather Radar with an updated design, global weather coverage, and the ability to review conditions from the past several hours.
Looking ahead? The Future Events layer shows incidents and events planned for a selected date and time, where supported by the reporting agency or data provider. Enabling this layer temporarily turns off the other map layers so you can focus on upcoming events.
- Save and share camera video walls. You can now bookmark or share a camera video wall by copying the URL from the Traffic Cameras player window. Open that link to restore the wall, or share it with another RITIS user. Updates also improve how selected camera feeds are preserved when refreshing the map.
Cameras without an active video or image feed now have an “Unavailable Feed” icon, making their status easier to identify.
- Find incidents without a precise map location. The new Show Unmapped Incidents option lets you view incidents that lack a specific map location. The sortable table includes available location descriptions, incident types, and update times, helping you find information that would otherwise be missing from the map.
You can also open RITIS Chat directly from supported incident and event popups.
- See more detail and follow movement. Traffic detector graphs show speed, reference speed, and traffic volume within map popups. Optional movement trails help visualize the paths of vehicles, aircraft, and vessels. A pop-out radio player lets you move radio scanner players into a separate window.
Behind these features are improvements to probe-speed data loading, map responsiveness, and memory use, along with fixes for Safari loading, popup behavior, and camera-image refreshes.
Probe Data Analytics
- Improved Work Zone Performance Reports. Work Zone Performance Reports (WZPR) received several improvements to calculations and presentation:
- Corrected average travel-time delay calculations.
- Improved PDF exports for compatibility with Adobe Acrobat.
- Added the option to hide Waze events in report results.
- Replaced failure messages with clearer “no data” messages for unsupported delay sections in reports using HERE TS segments.
- More control over MAP-21 reporting. You can now choose the census year for urbanized areas in the MAP-21 widget editor. Map widgets use the data associated with the selected census year, and reporting forms better preserve your urbanized-area selection when switching between census years.
- More reliable same-day analyses. Updated caching behavior allows same-day analyses to retrieve fresh results when reopened, rather than retaining an earlier, incomplete snapshot. Additional fixes address report crashes and problems opening CScan from Bottleneck Ranking.
- Easier dashcam navigation in CScan. CScan now includes dashcam loading indicators and previous/next buttons for browsing images. Dashcam icons are also included in CScan image exports.
Signal Analytics
- Smoother queries. Signal Analytics updates corrected day-of-week ordering and resolved a query-form crash involving signals located far from the selected geography.
- A new reporting resource. A new Signal Analytics report template in Learn RITIS also provides a starting point for organizing and presenting your analysis.
Trip Analytics
- A new dashboard to explore. Trip Analytics introduced a beta Global results dashboard, providing a new results view to explore.
- Larger uploads. The upload limit has also increased, allowing larger uploads.
Explore these updates the next time you sign in to RITIS. Availability may vary based on your agency’s permissions and data access.