We are the CATT Lab
The Center for Advanced Transportation Technology Laboratory at the University of Maryland supports national, state, and local efforts to solve important transportation, safety, and security problems. We accomplish our mission by deploying innovative technology and user-centered software and visualization systems.
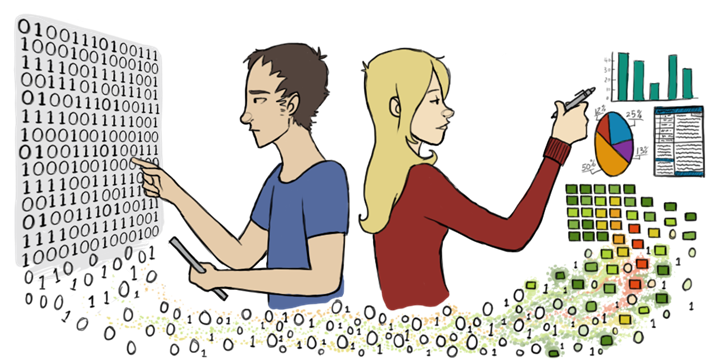
Information visualization
The CATT Lab develops visual analytics and information visualization tools that lead users to insights that would be difficult, if not impossible, to discover through traditional data analysis techniques. The old adage that “a picture is worth a thousand words” rings true.

The CATT Lab pioneers new ways of looking at data for the benefit of transportation practitioners and the public at large. For over a decade, our platforms have been converting billions of daily data points from across the nation into actionable information available at a moment’s notice.
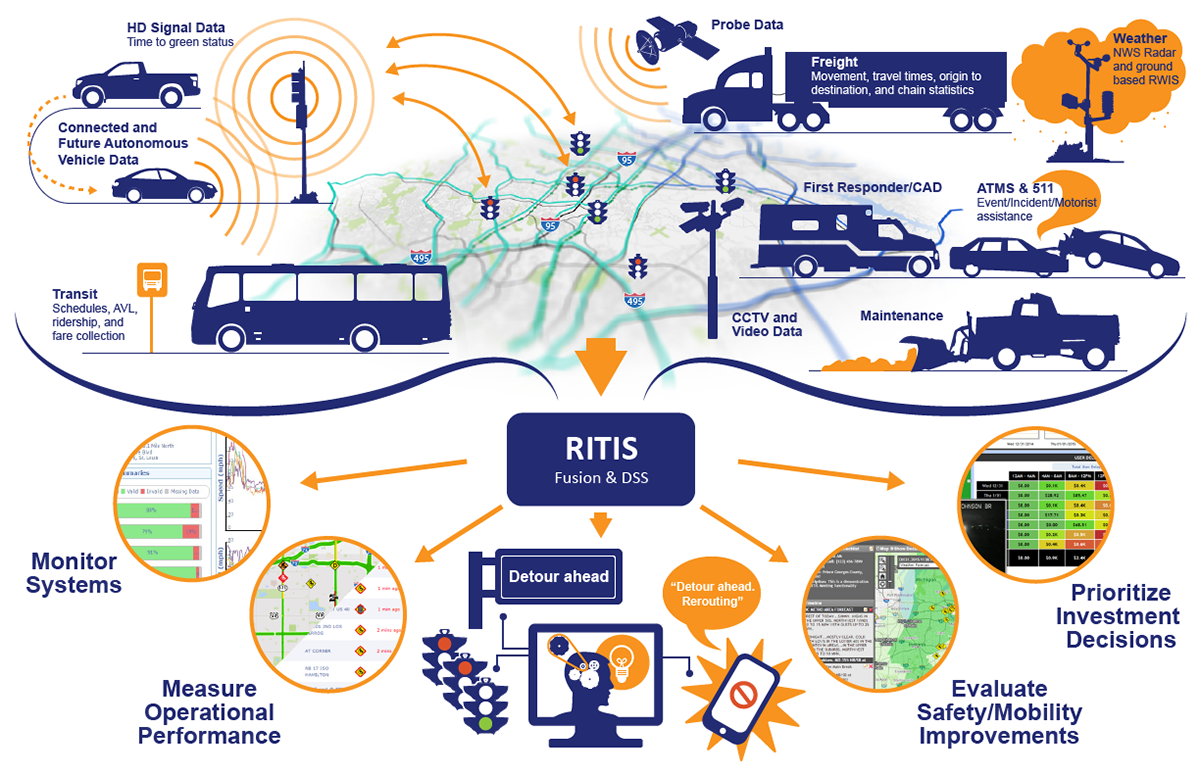
Our visualization tools, such as RITIS and the Probe Data Analytics Suite, are utilized by thousands of transportation professionals nationwide to enhance traffic operations and transportation planning.
We continue to explore visualization opportunities outside the transportation industry. For example, the CATT Lab partnered with the Maryland Transportation Institute to develop our COVID-19 Impact Analysis Platform, which visualizes health, demographic, and economic impact data, as well as mobility data.
Data fusion
The CATT Lab develops systems that fuse and integrate hundreds of gigabytes of data per day in real time from emergency operations centers, transportation management centers, thousands of sensors, CCTV cameras, and sub-systems throughout the country.
CATT Lab employees are experts in database management systems, database tuning, standards, geospatial data management, and data processing optimization. Their real-time data fusion systems are relied upon by thousands of users across the nation on a daily basis. The CATT Lab’s data fusion, dissemination, and analytical systems and are considered the gold standard by planners, law enforcement, operations, defense, and private sector freight companies.
The RITIS Incident Timeline fuses essential information on traffic incidents into one simple display.
The RITIS Map presents over a dozen real-time geospatial data feeds on a single map to show real-time transportation conditions over an entire region.

User interface design
Understanding the big picture and working effectively in data rich
environments can be hard. The CATT Lab has years of expertise in developing user interfaces for large-scale, complex systems that enable users to quickly and easily comprehend the results of decisions and to help them to navigate through sophisticated software with minimal effort and maximum efficiency. Proper user interface design is both a learned skill and a trained art.
The CATT Lab’s design team and human computer interaction experts design software that significantly enhances user experiences–leading to greater acceptance and increased workflow.


Performance measurement & analysis
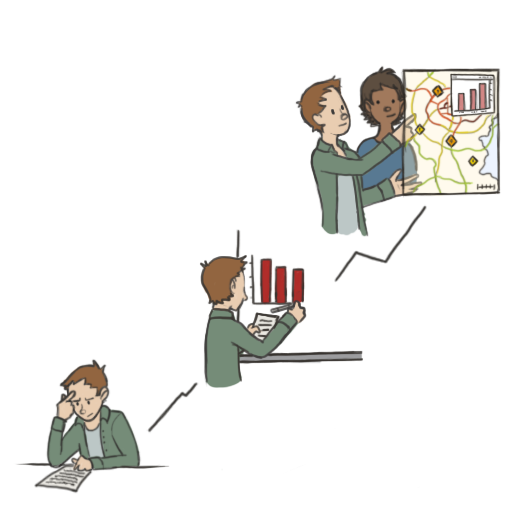
Data is everywhere. Collecting, analyzing, and sharing information effectively is an essential activity in today’s knowledge-based economy. At the CATT Lab, we fully believe that data should be analyzed and displayed in ways that make it understandable and accessible. The CATT Lab works closely with local, state, and federal agencies in support of analyzing large datasets from sensors, probes, police accident records, or other databases. Our goal is to make this information easily understandable by diverse user groups from engineers to managers, public officials, and the general public. Data can “tell a story” about important issues that conveys meaning and importance.
The Maryland Transportation Authority turns to RITIS and new report templates to provide a Labor Day travel forecast to the traveling public.
Ohio DOT optimizes signalized corridors throughout the state using the Travel Time Delta Ranking tool in Probe Data Analytics.
