
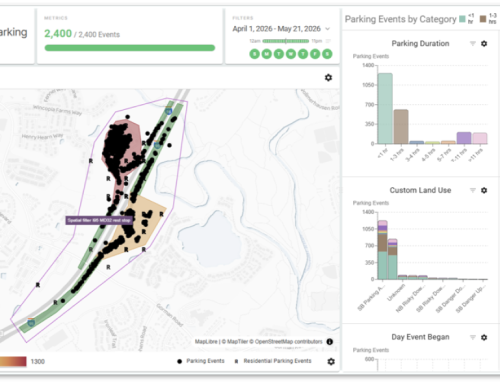
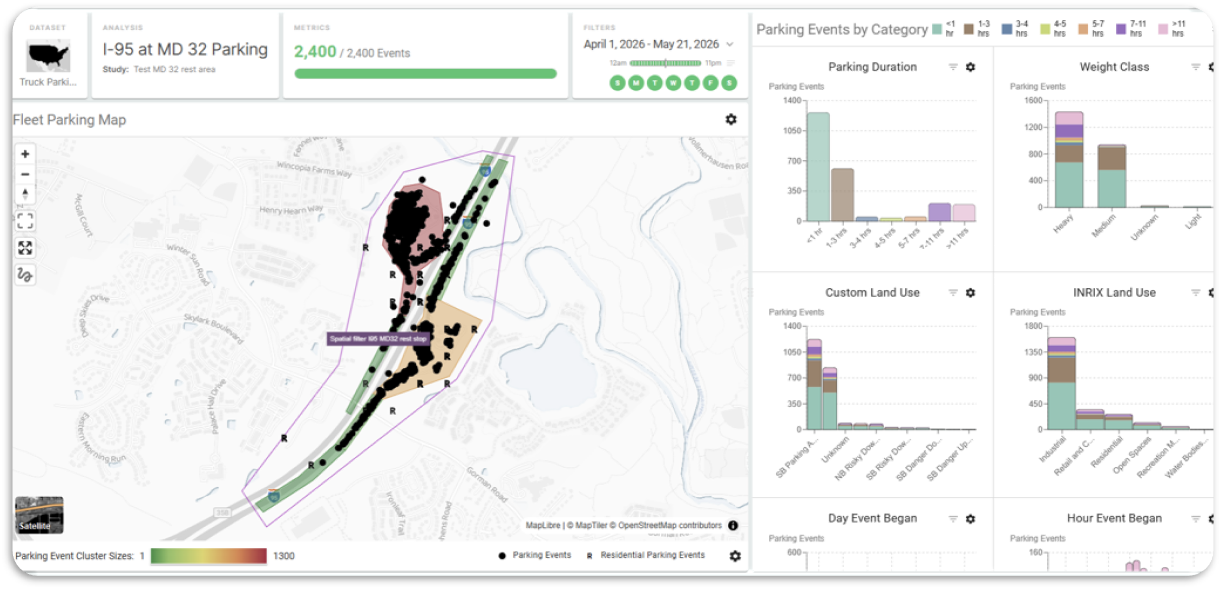
The latest RITIS Probe Data Analytics update introduces four powerful tools to elevate your data insights. The Energy Use and Emissions Matrix delivers an interactive, color-coded matrix tracking energy and emissions metrics across custom road segments and hourly breakdowns, with downloadable CSV results. Energy Use and Emissions Trend Map brings time-stepped, animated map visualizations of sustainability metrics, complete with playback controls and options to save animations as GIFs or MP4s or export the results to integrate into your GIS platform of choice. Energy Use and Emissions Charts offer flexible breakdowns—bar, pie, or scatterplot—of energy use and emissions by road class, engine type, or time, paired with detailed data tables for export. Finally, Vehicle Ownership Charts dives into regional vehicle trends using zip code-level registration data, presenting annual engine-type breakdowns in bar charts alongside interactive maps. These tools empower users to dissect and visualize transportation data like never before—dive in and explore!
